JVM - Analyzing Memory & Performance Issues
 </img>
When it comes to application development, its always better to be a pessimist rather than an optimist. Irrespective of how good a developer you are are, the application will surely run into some unforeseen issues once its running in production environment.
Out of memory exceptions every now and then which requires Tomcat to be restarted or a case of degrading application performance which disappears after server restart but reappears after the application has been running for some time.
Such kind of unpredictable behavior of the application is sure to leave every developer flabbergasted. One standard reply most of them will come back with is that “I am not able to reproduce this on my machine !!! Don’t understand what’s going on in PROD”. :-)
Such problems are not difficult to isolate but would require the use of the right tools, perseverance and lots of patience.
In this post, I will explain how to use VisualVm to troubleshoot issues with you application deployed or running or Tomcat.
##Configuration
Visual VM is a JVM profiling tool built on top of JDK tools (jstat,JConsole,jStack,jmap,jinfo).
It does a nice job of representing the data retrieved using the JDK tools in a nice graphical manner.
Visual VM allows you to generate and analyze heap dumps for memory leaks, monitor application heap space , garbage collection activity, CPU usage, threads and many more.
The best part is that Visual VM is open source. Its licensed counter part is YourKit. Setting up Visual VM with Apache Tomcat
- Download and install Visual VM from here
- Enable JMX remote on Tomcat so that VisualVm can connect to it.
1
To do this, edit catalina.bat(Windows) or catalina.sh(unix) and add the following line
set "JAVA_OPTS=%JAVA_OPTS% -Dcom.sun.management.jmxremote.ssl=false -Dcom.sun.management.jmxremote.port=9090 -Dcom.sun.management.jmxremote=true -Dcom.sun.management.jmxremote.authenticate=false -Djava.rmi.server.hostname=<IP-Address-Of-Tomcat-Host>"Explanation:
com.sun.management.jmxremote.ssl=false
#This will disable SSL while monitoring remote machines`
com.sun.management.jmxremote.port
#Specified the port where RMI registry can reach out to.
com.sun.management.jmxremote
#Allow JMX client to connect to local JVM. This was required in older JDK version(< 6.0).
com.sun.management.jmxremote.authenticate
#Password authentication for remote machine is enabled by default. This needs to be set to false.
java.rmi.server.hostname
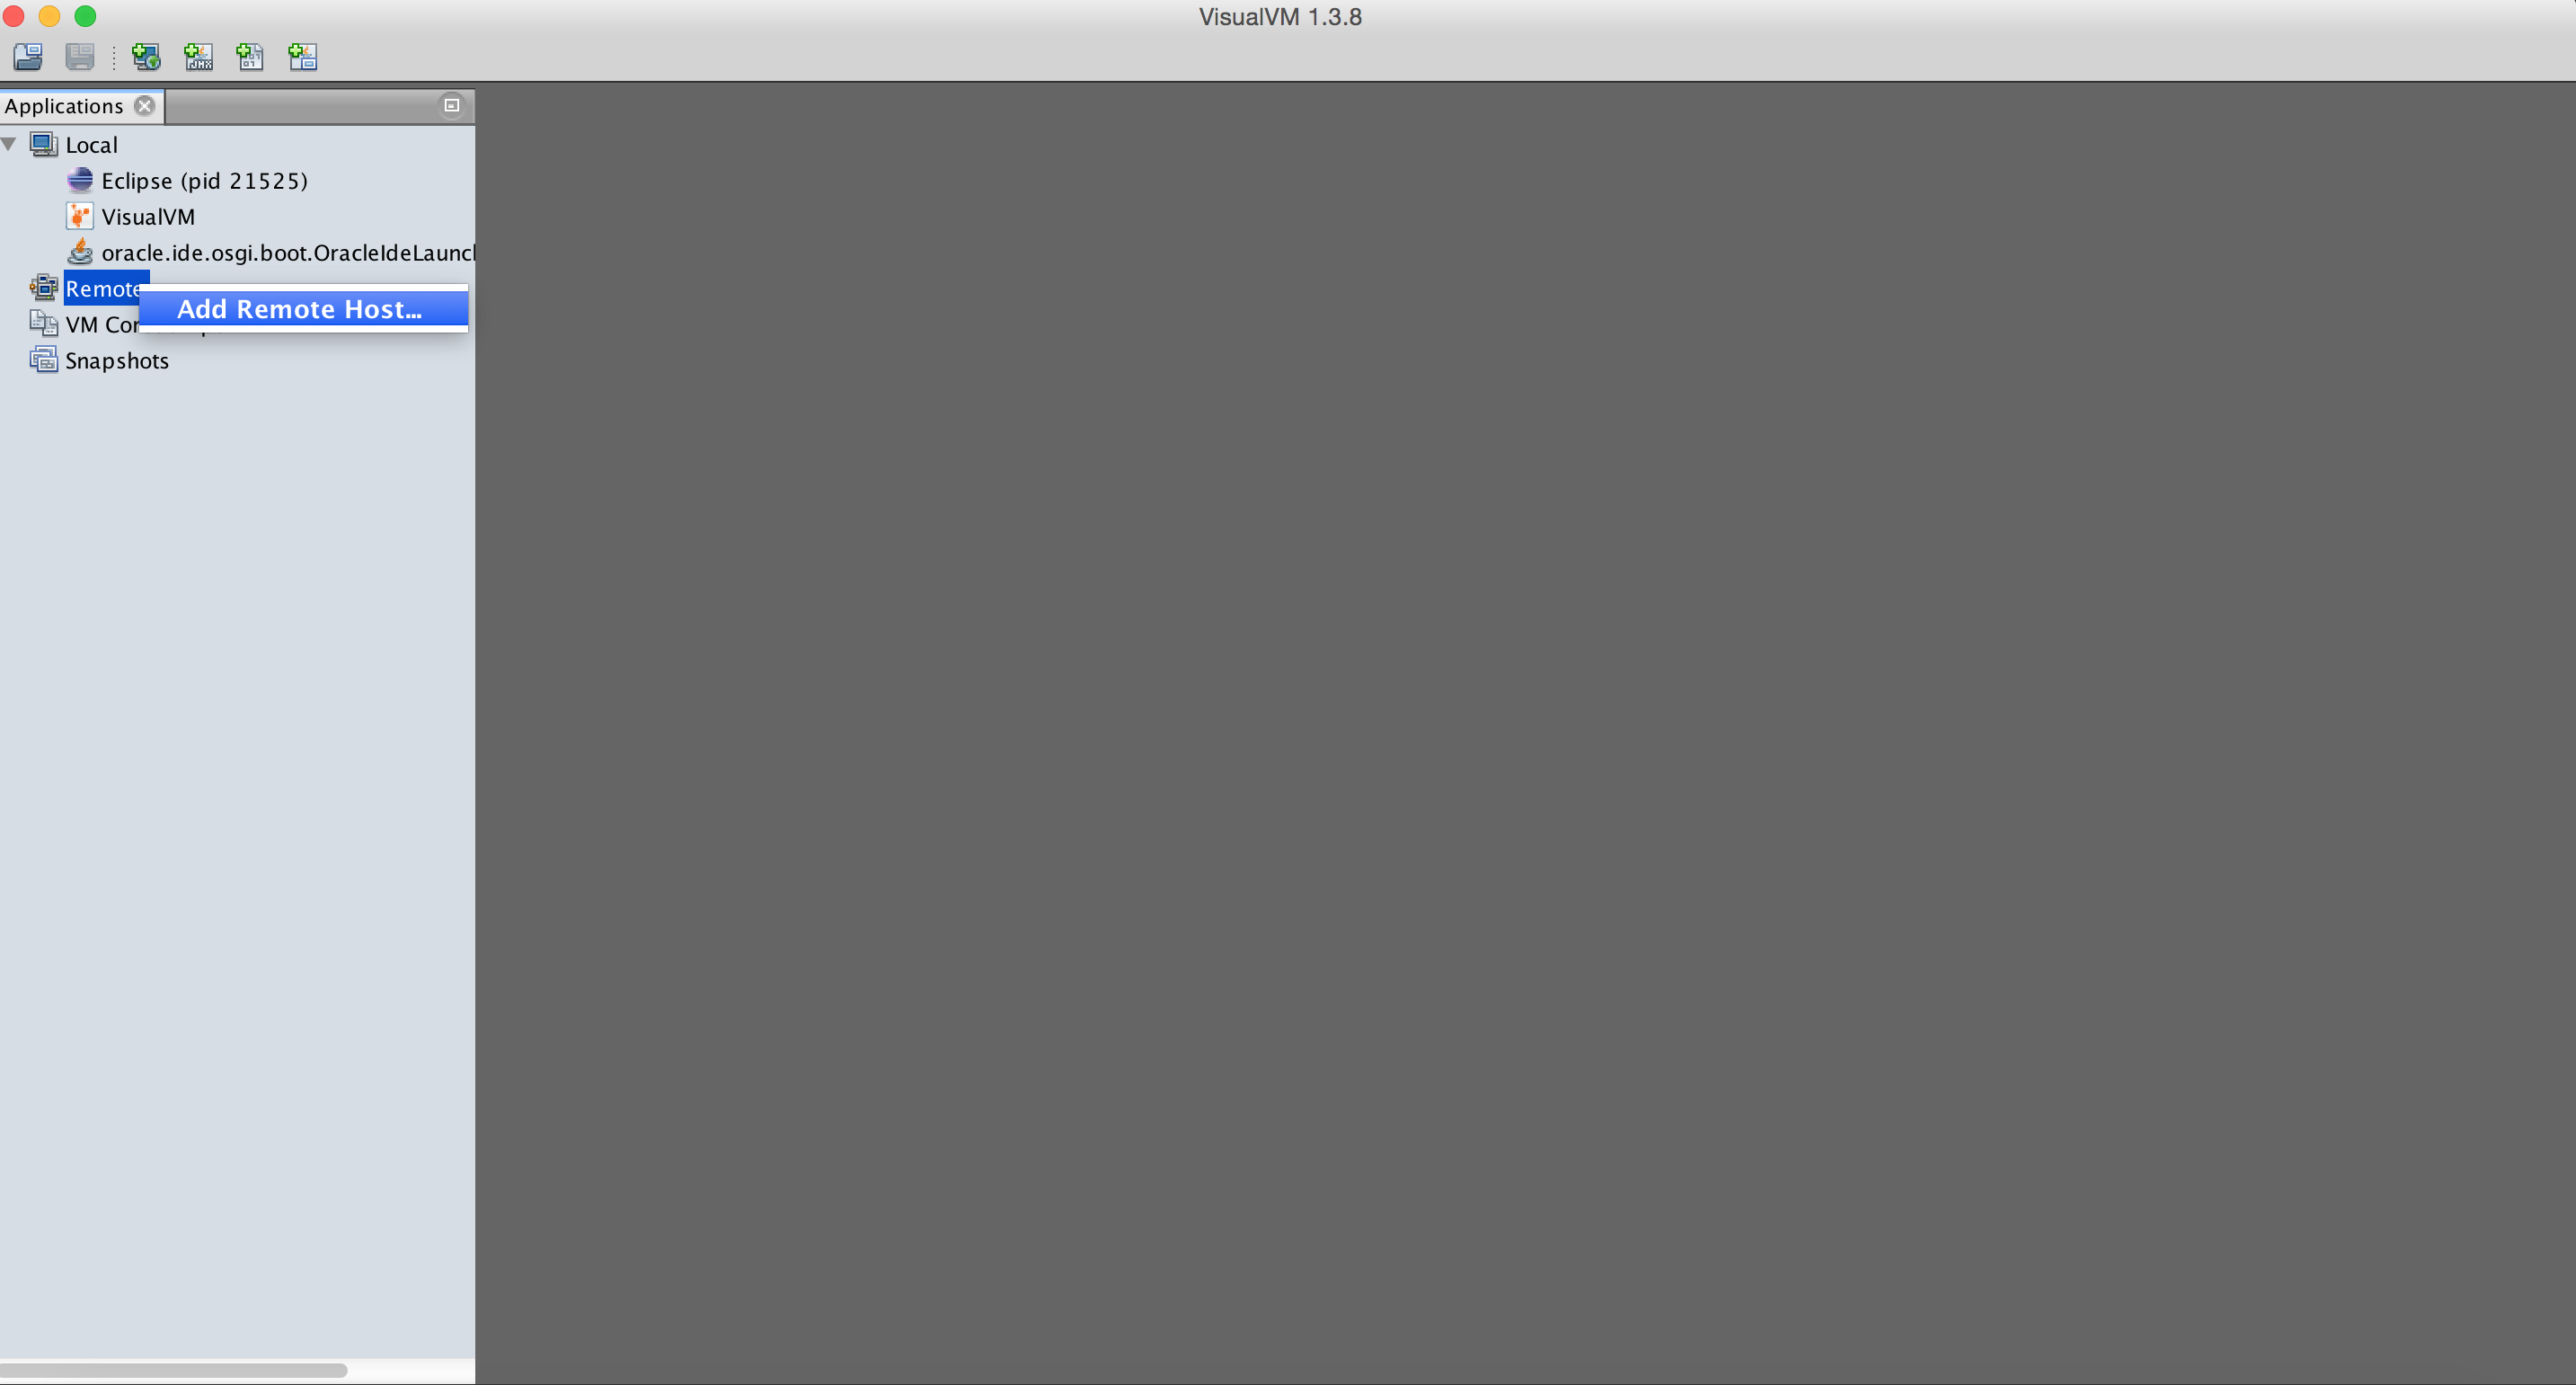
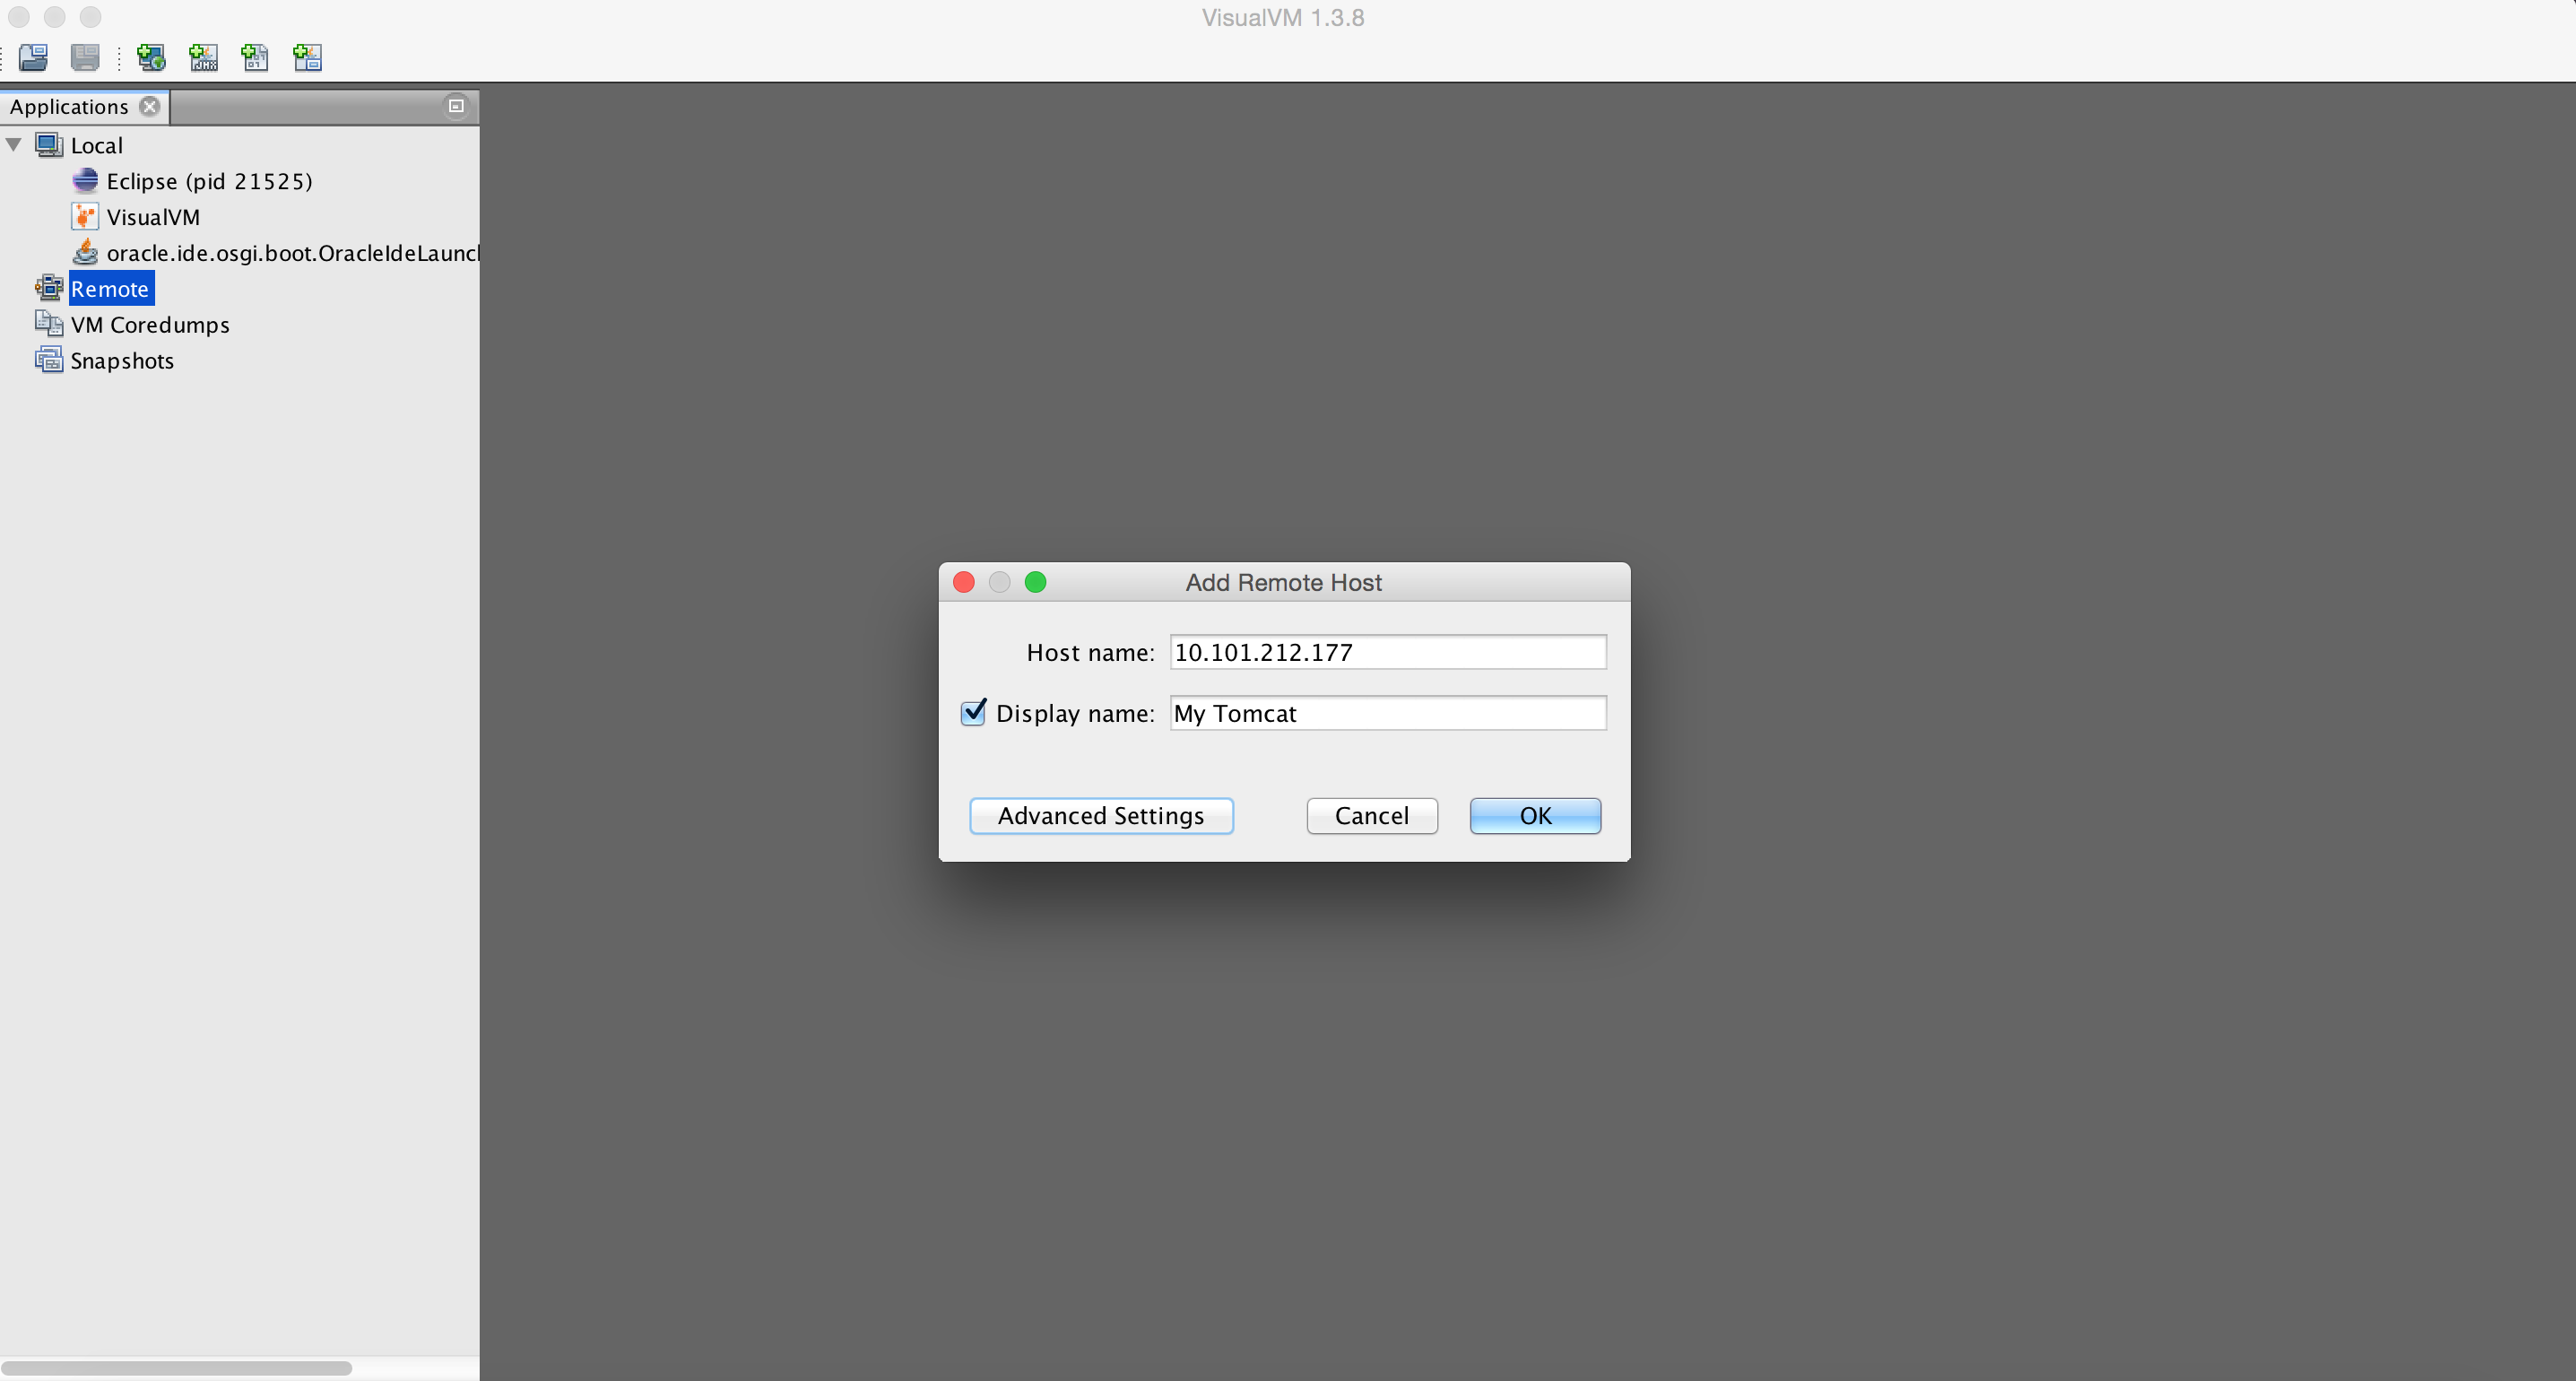
#Set the IP address of the host whose JVM needs to be profiled.- Start Visual VM and add the ip address of the host running the tomcat to Visual VM.
 </img>
 </img>
- Once you add the host, a tab should appear on the screen. Information about the Threads and Monitors can be found in the sub tabs.
##Making Sense Of the Data
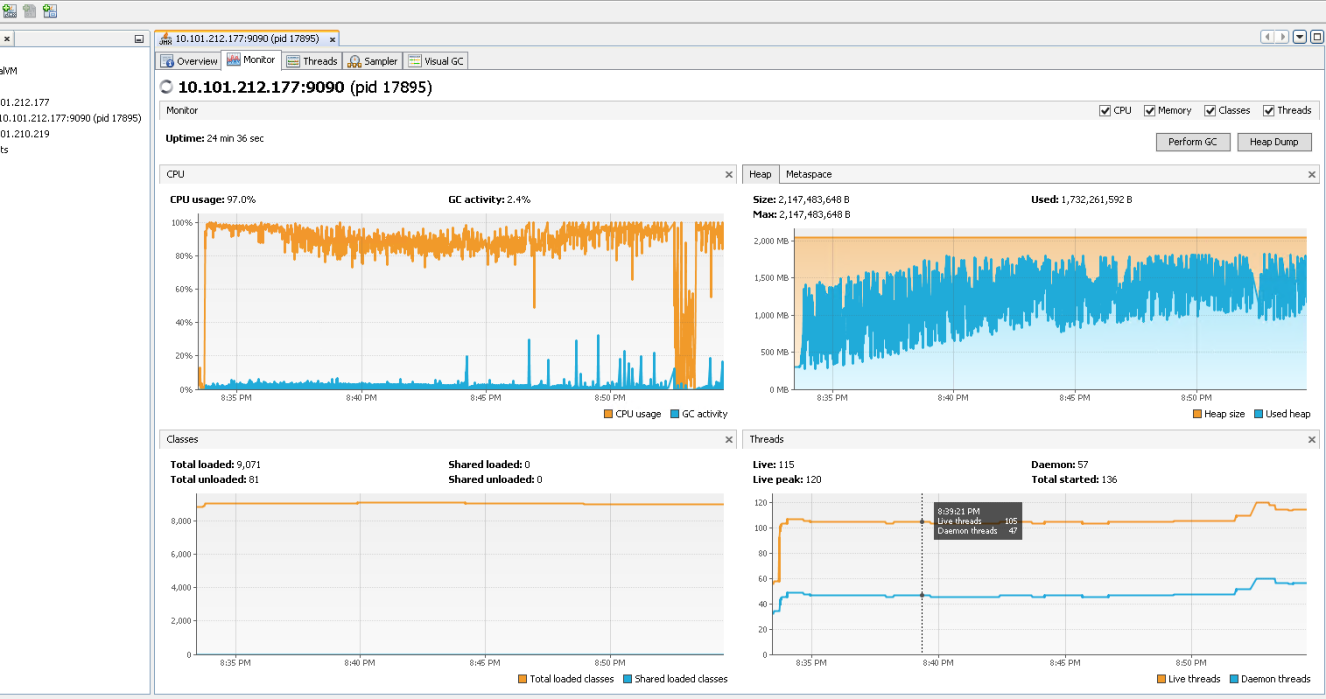
Below is a screenshot of an application which seems to be taking up close to 100% of the CPU and also peaking up the heap space usage.
This is one of the common scenarios that one might encounter in real world. The below graph was collected during a medium load level testing operation that spanned over a period of 20+ minutes.
If you look at the heap graph(right side) you can see that the heap space kept gradually increasing and also there are some lows now and then. If you compare the low’s in the heap graph against the GC activity and CPU usage on the CPU graph(left side), you can see a clear relationship between them.
The lows in the heap graph corresponds to Garbage Collection activity performed by the JVM. Heap goes down when the GC activity increased and at the same time the CPU activity also goes down. This because GC’s are stop the world process. When the JVM is performing a major GC it might cause Tomcat to stall and stop handing requests, which in turn will lead to the front-end client seeing additional latencies or errors.
If the heap continues to increase then it will eventually lead of PremGen or OutOfMemory Exception.
 </img>
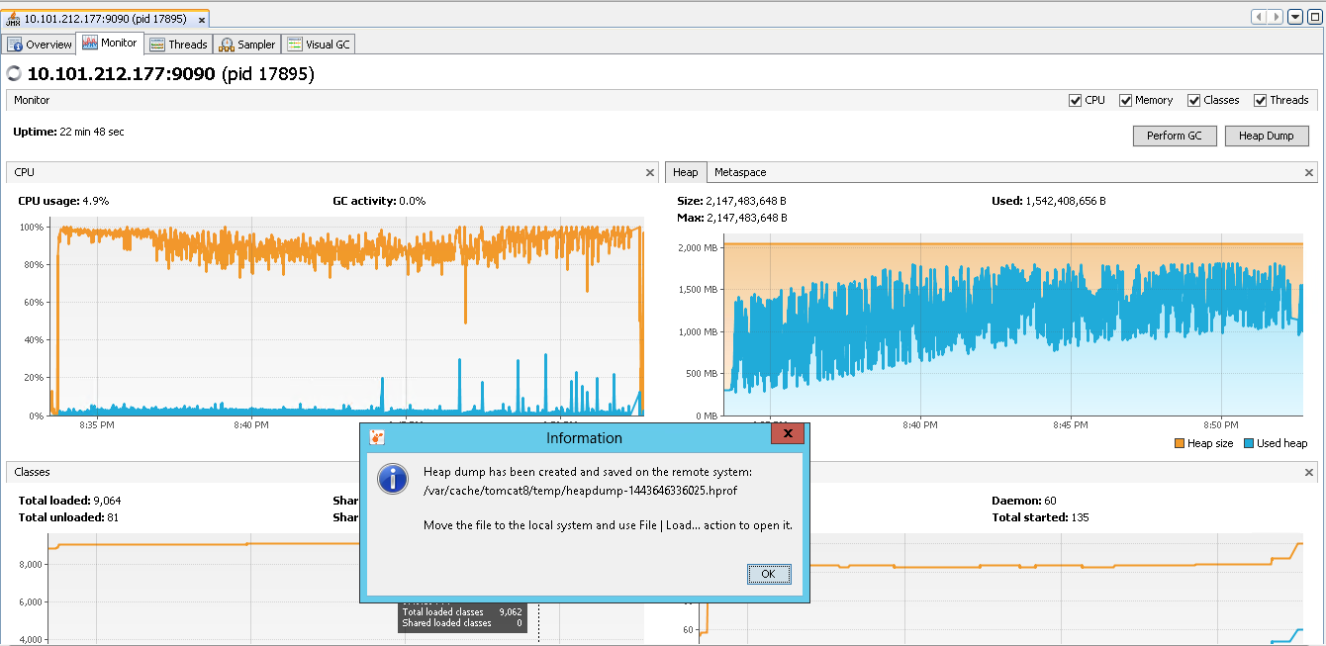
To troubleshoot the memory issue you can take a heap dump of the JVM using the ‘Heap Dump’ button present on the VisualVM tool. The heap dump is like a snapshot of object in the memory.
The heap dump is usually stored on the machine running the JVM.
 </img>
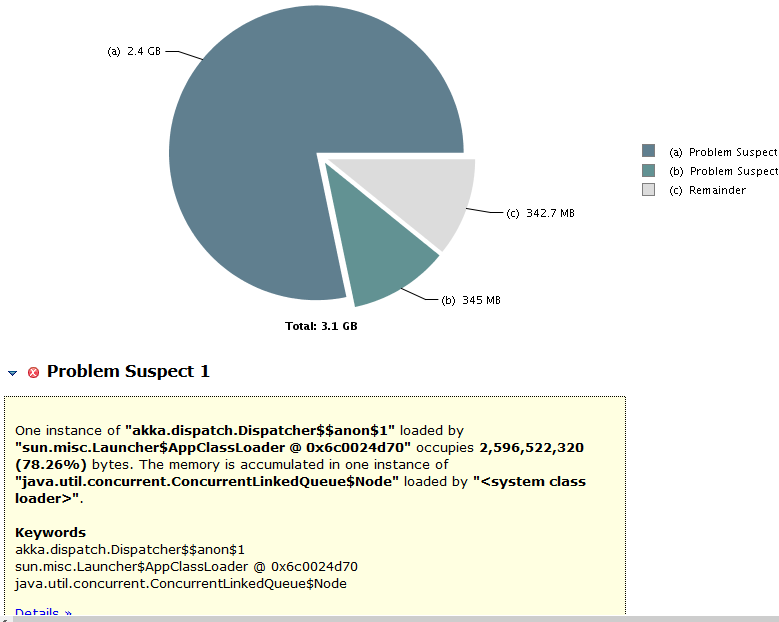
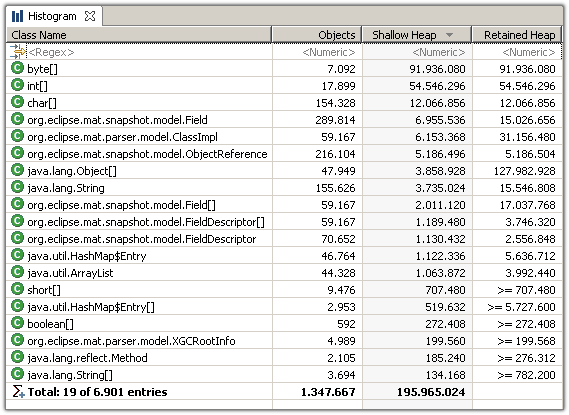
You can use eclipse plugins like ‘Eclipse Memory Analyzer’ to open the dump and look at what objects are the reason for the memory leak.
Once you have installed the plugin, in eclipse you can go to File-> Open file -> (Select the heap dump .hprof file). The plugin will automatically start analyzing it and render graphs and histograms for you.
Below is a sample graph. It tells you how the heap space is divided between different objects and also lists what objects and corresponding classes are causing this issue. With this information you can go back to your code and investigate the reason for the objects not being eligible for garbage collection.
 </img>
 </img>