MicroService Logs - Collect & Search
A distributed architecture brings in several challenges when it comes to operability and monitoring. Here, one may be dealing with tens if not hundreds of microservices, each of which may or may not have been built by the same team.
With a large-scale system, it is very important to have eyes on key system metrics, application health and enough data to be able to track down issues quickly and mitigate them. Being in a CLOUD environment such as AWS, Google Cloud, Azure further accentuate the problem and makes it difficult to detect, troubleshoot and isolate an issue due to the dynamic nature of the infrastructure (scale up / down, temporal machines, dynamic IPs etc.).
Key pillars of Observability:
- Metrics - Application metrics, Host/System metrics, Network metrics etc.
- Logs - Application and supporting infrastructure logs
- Traces - Track down a flow of a request through the distributed system
Logs
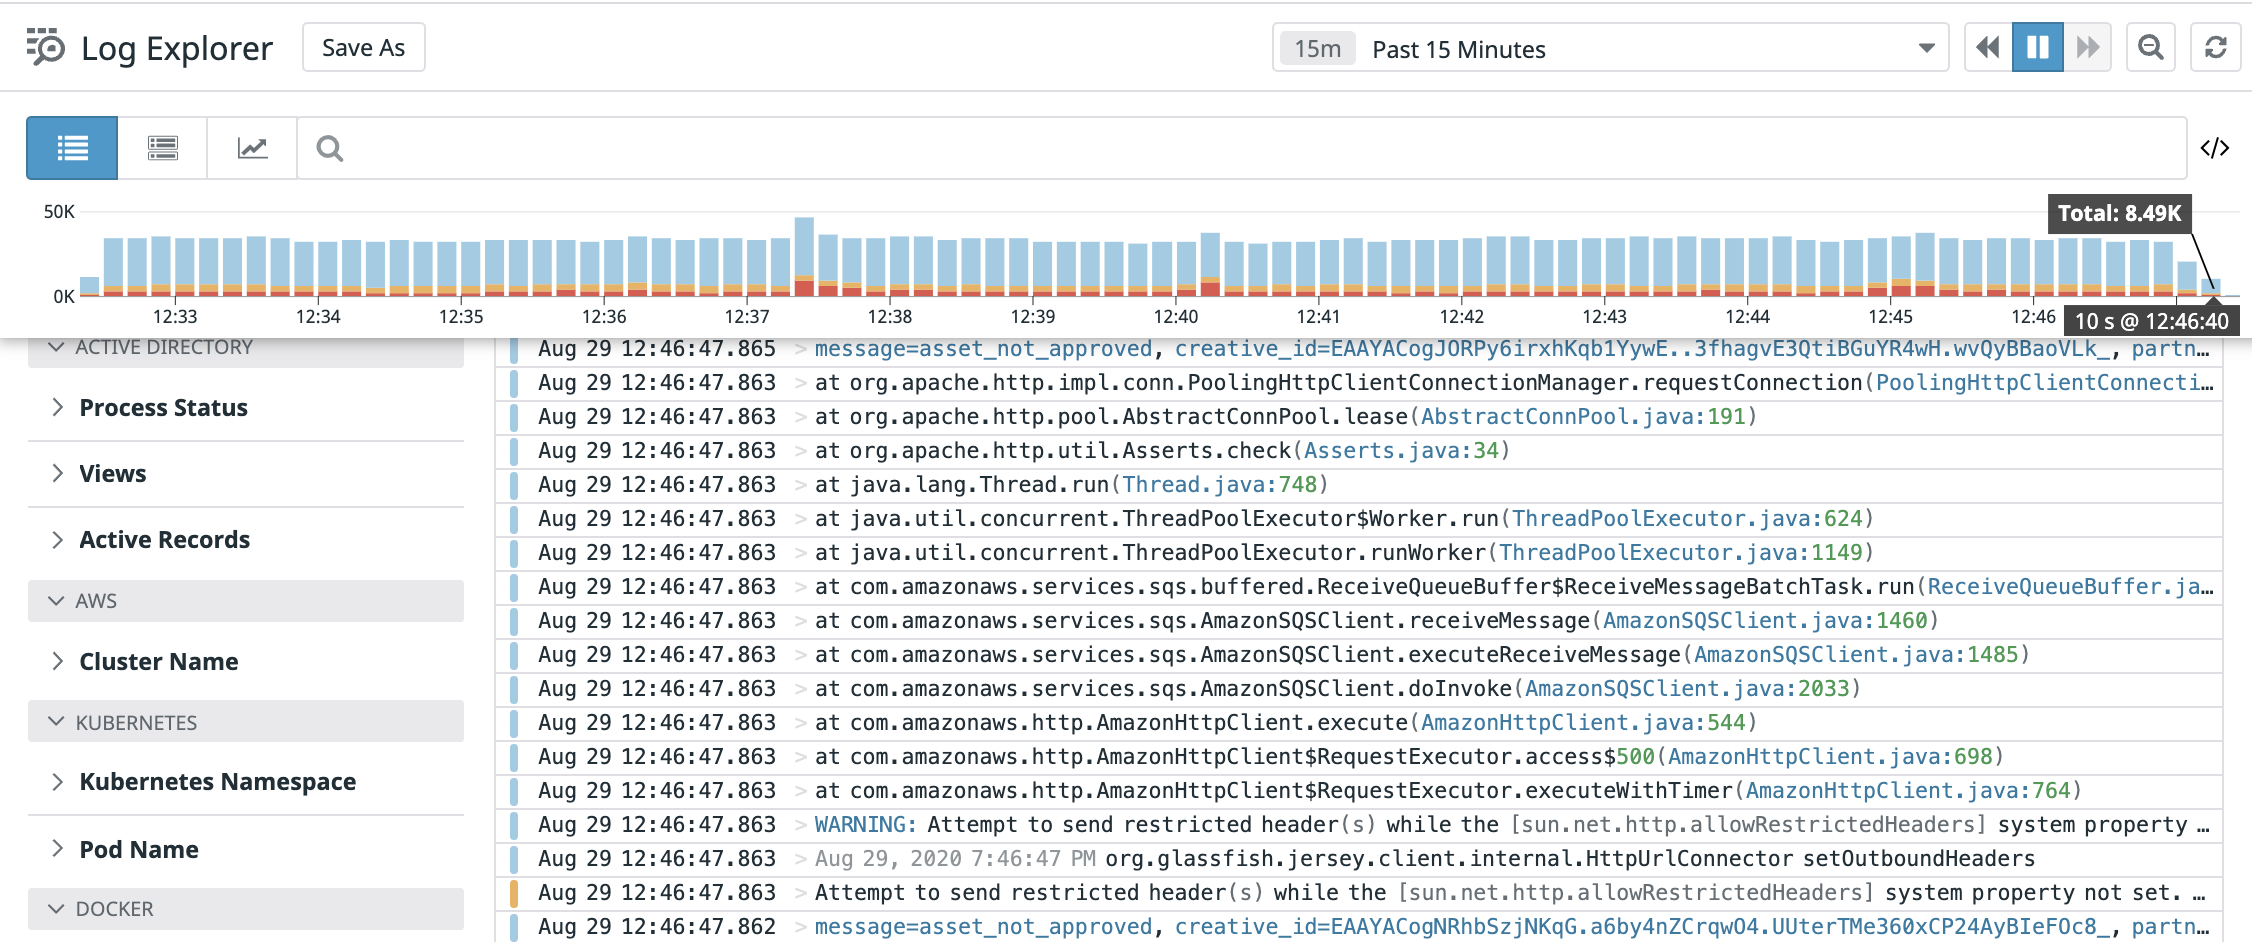
With the distributed architecture it has become a standard practice to use centralized logging systems to be able to gather logs and visualize them. Logs generated by different microservice will be automatically shipped to a central location for storage and analysis. Some of the popular centralized logging solutions for application logs are : Logs provide useful information about events that have occurred within your application. These could be INFO level logs or error logs with detailed stack traces around exceptions.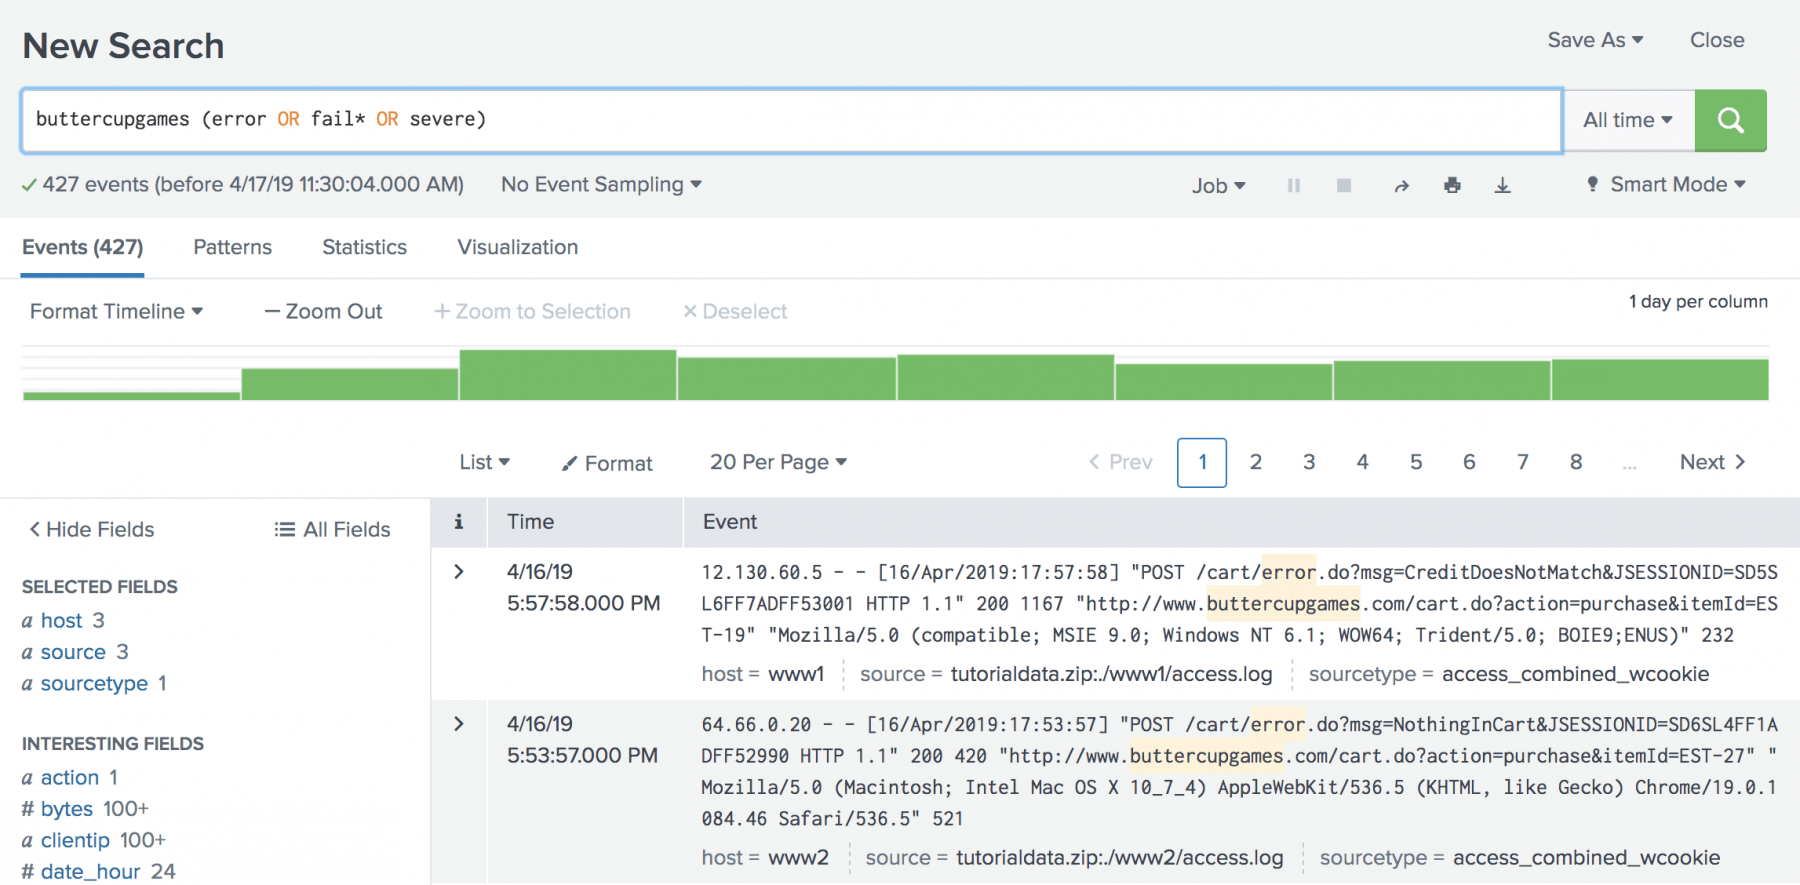
Log Correlation Across Microservices
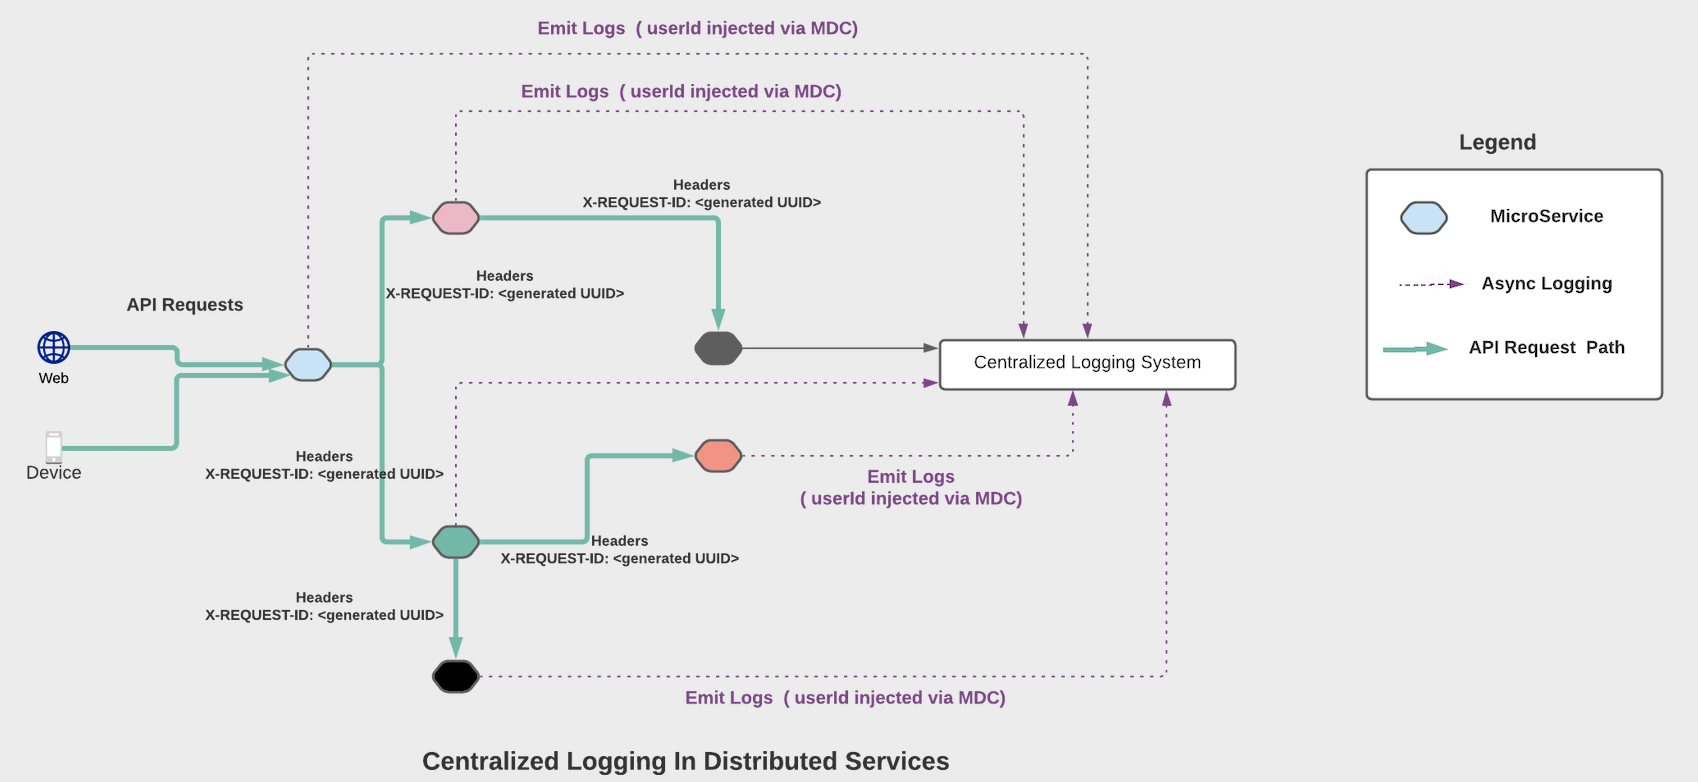
A centralized logging system in a large distributed application may be ingesting Gigabytes of data per hour, if not more. Given that a request may be travelling through multiple microservices, one way to query all logs related to a request spanning several microservices is to attribute each request with some kind of unique identifier.
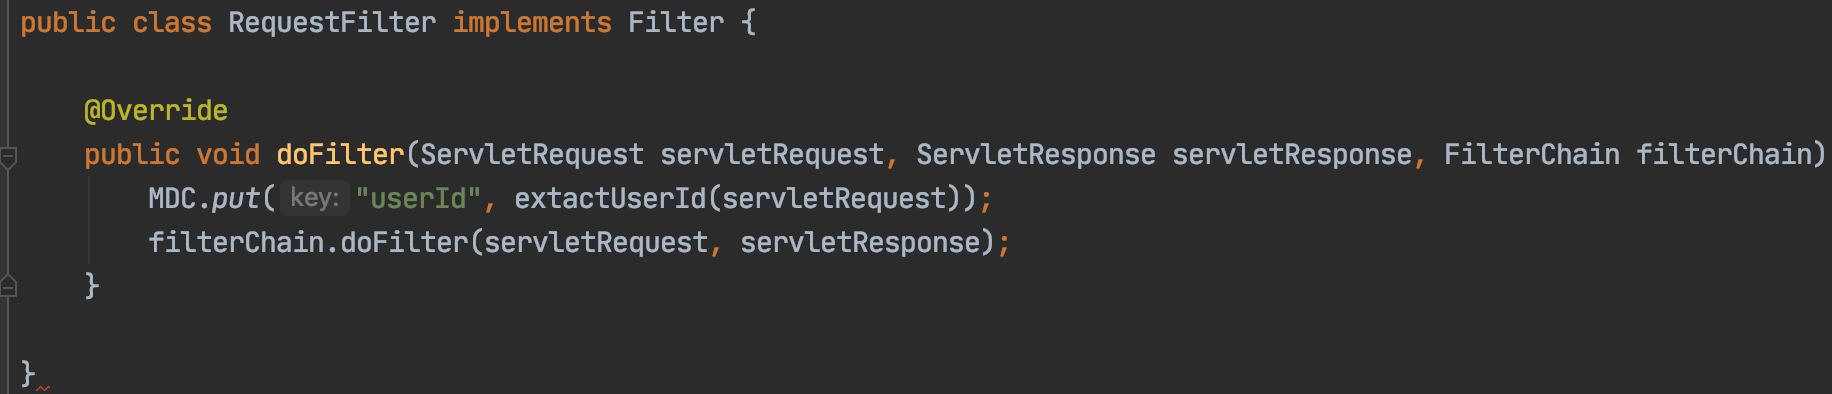
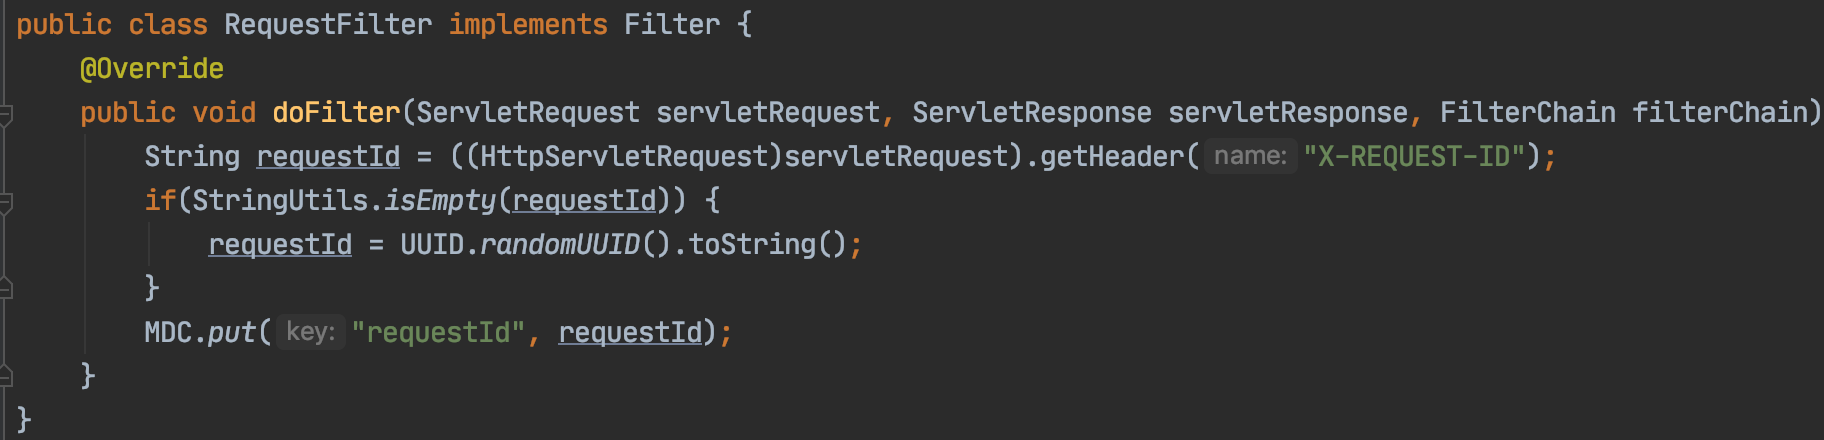
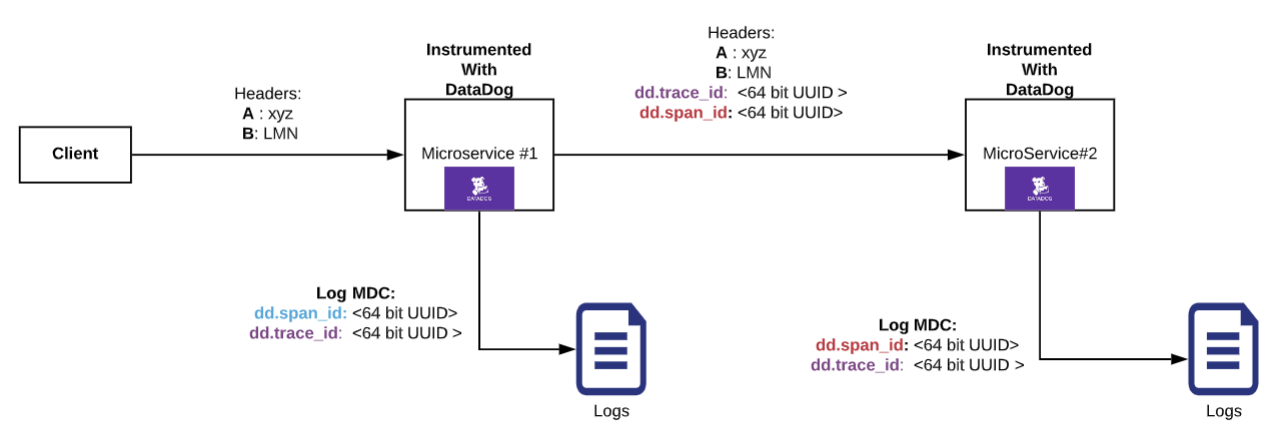
In most cases this could be a userId associated with the request or some sort of unique UUID generated at the first point of ingress into the application. These identifiers will be attached to each and every log message and are propagated downstream from one microservice to another via request headers (in case the identifier is not part of the request being made downstream). Now one can easily use the requestId or userId to query the logging system to find all logs associated with the request across multiple services !!!
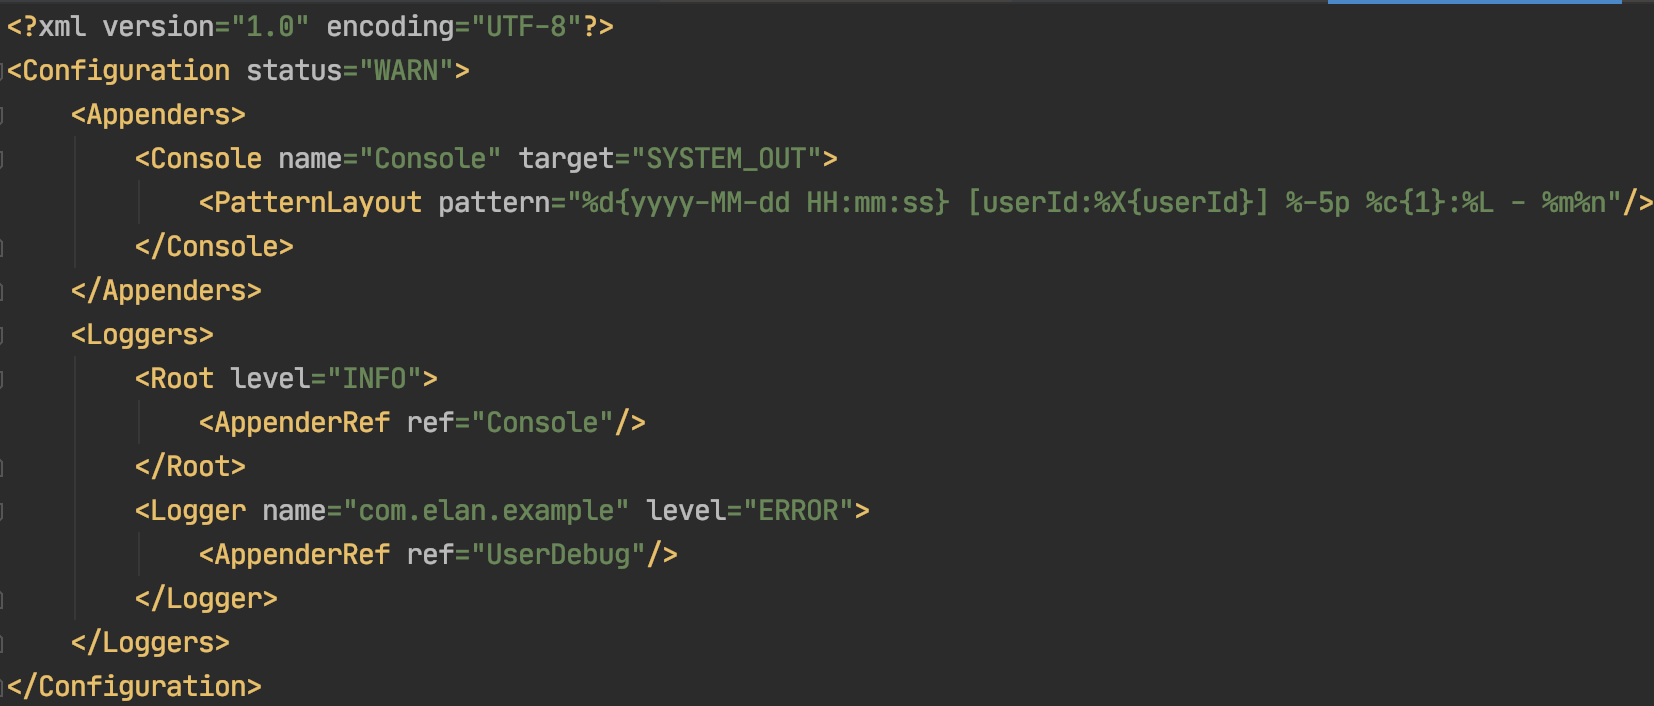
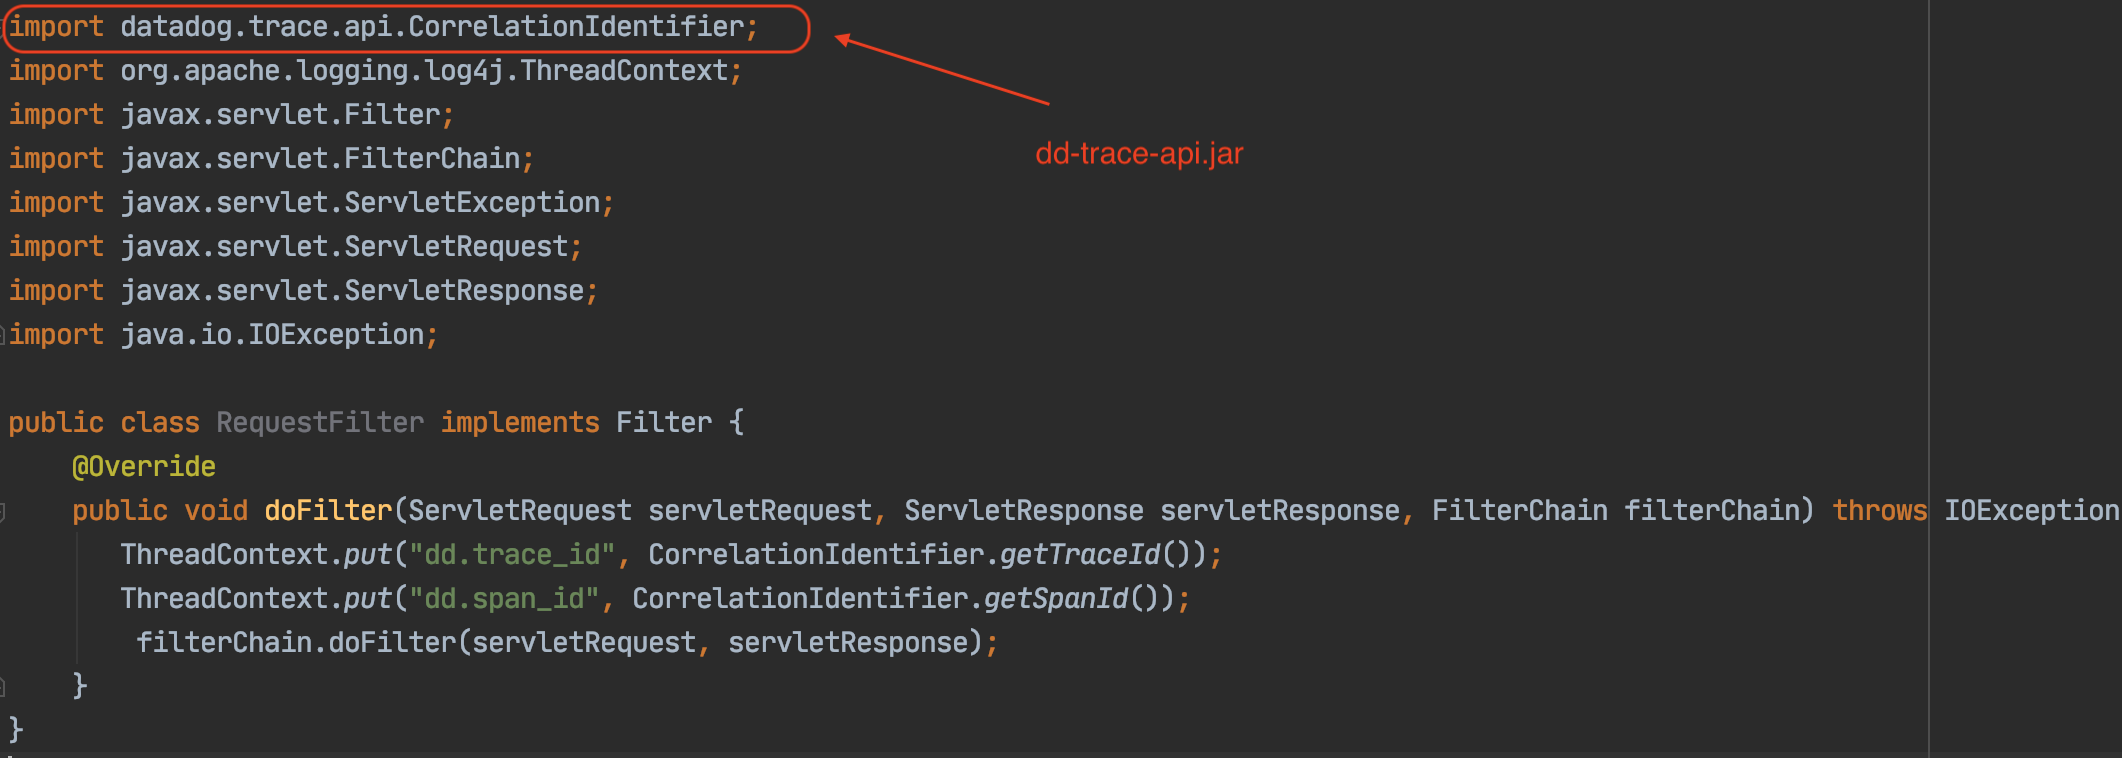
Below are few examples of how to tag your logs with required information in Java using Request Filters.

Tracing
Tracing is a method which allows one to profile and monitor applications while they are running. Traces provide useful information such as:- Pathway of a request through the distributed system
- Latency of a request at every hop/call (as in from one service to another)
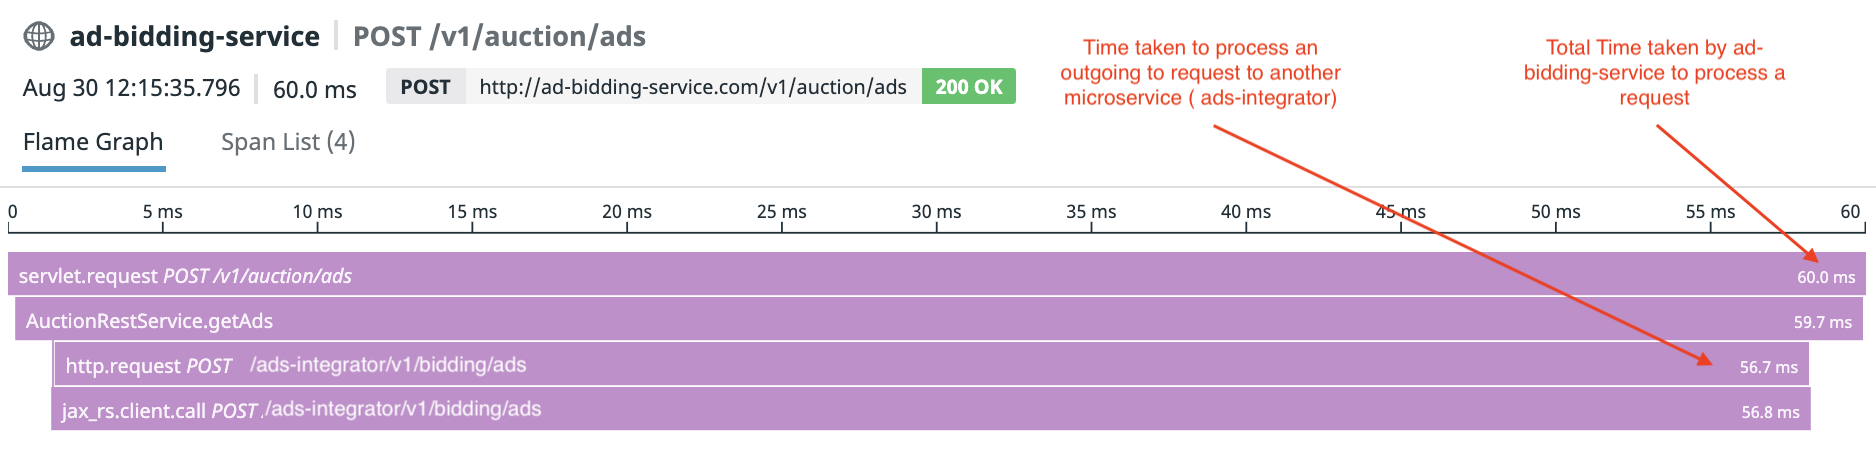
Components Of a Trace
A trace is composed of a tree like structure with parent trace and child spans. A request trace has scope over several services and is further broken down into smaller chunks by operations/functionality known as spans. For example, a call from one microservice to another encompasses a span. Within a microservice there may be multiple spans( depending on how many layers of classes/function or dependent microservices are called to serve the request).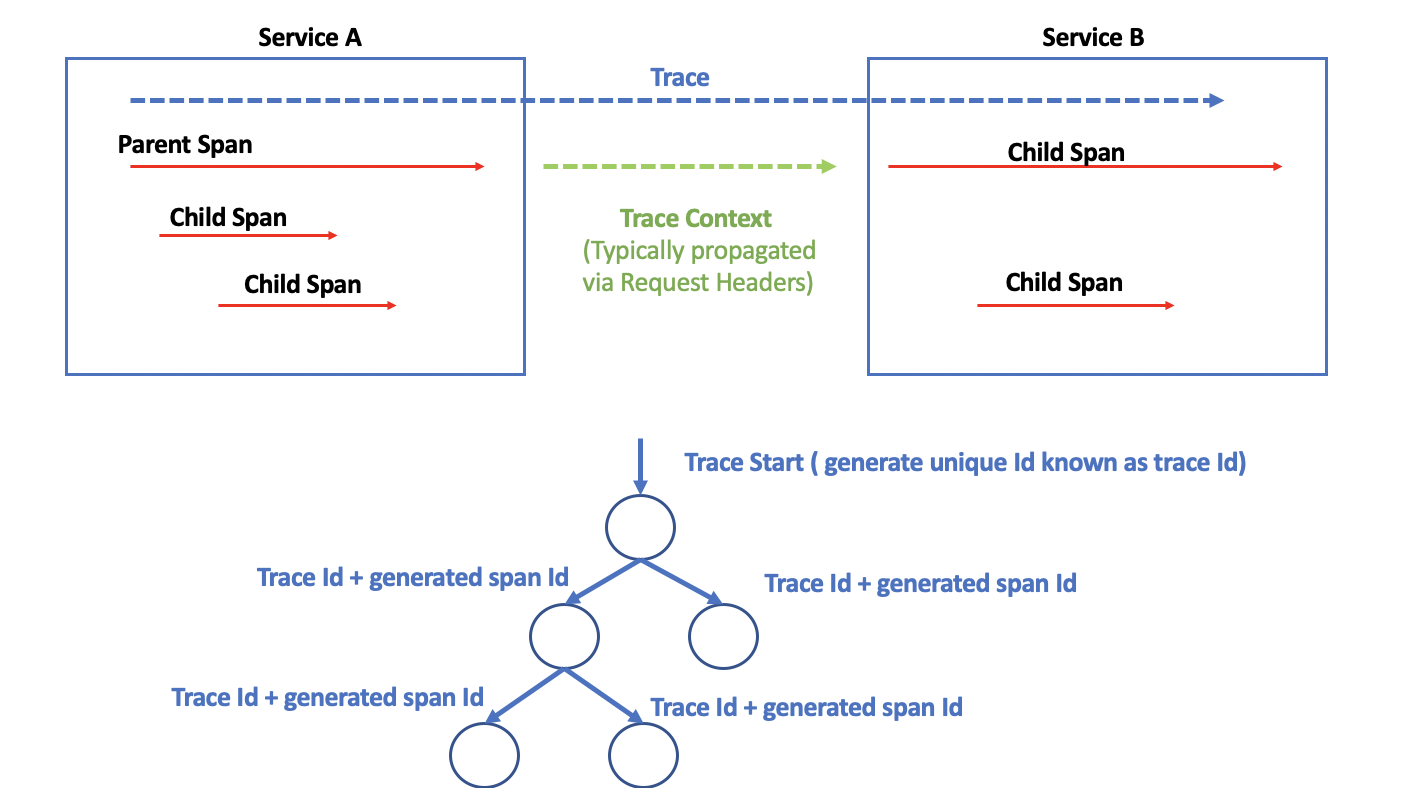
Logs & Trace Correlation
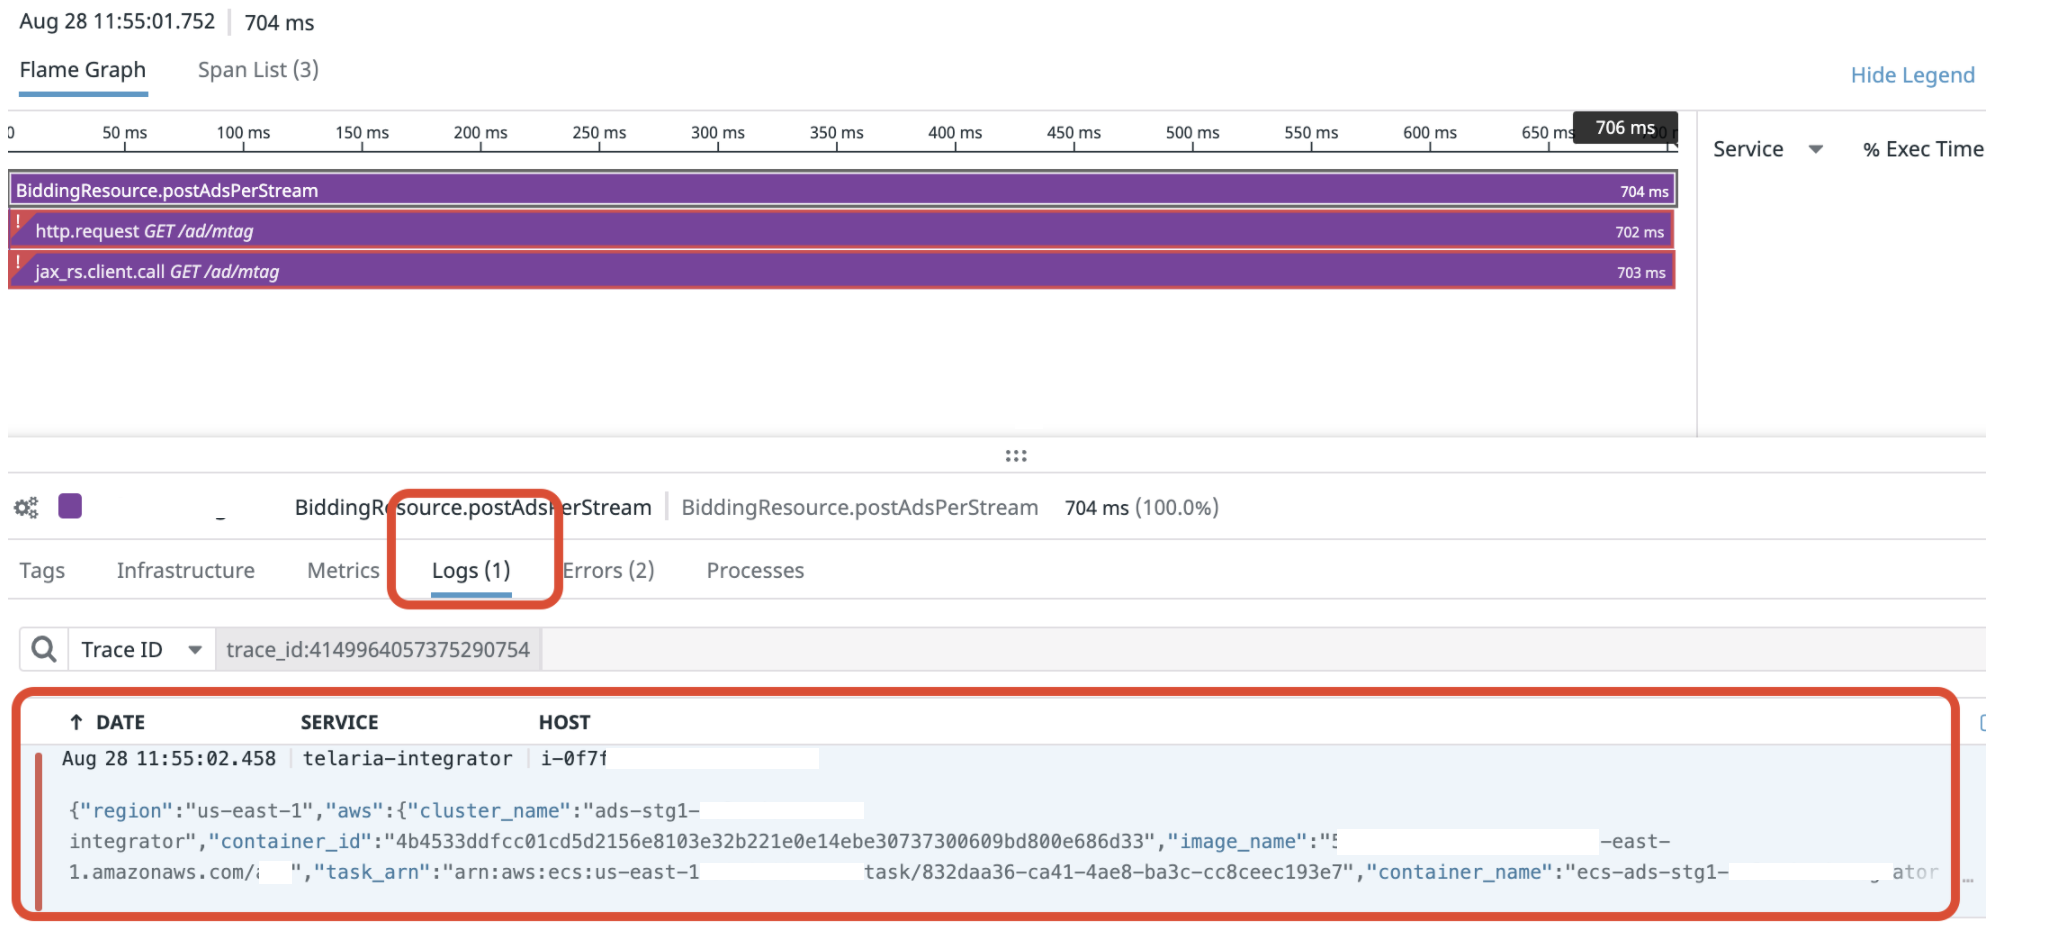
Now that we are able to search logs by userId or some other unique identifier (such as generated UUID) and are able to trace the performance/behavior of a single request. Would it not be great if we are able to tie these together and be able to correlate logs and traces for a single request !! Having this correlation between logs and request allows one to:- Correlate performance metrics directly with logs
- Be able to make ad-hoc request to the system for troubleshooting issues
- Enables synthetic transactions to be made against the system at different points in time and be able to compare current traces with historic ones and collect system logs related to these requests automatically
Implementing Distributed Tracing via Log-Trace Correlation
Approach #1: Instrumenting with 3rd Party Tools such as DataDog
Reference: DataDog APM In this approach we are instrumenting the services in the distributed systems with DataDog APMs (application performance monitors). Datadog does 100% tracing of requests and also is able to collect logs emitted by your applications. Datadog essentially takes care of all your centralized logging and trace information collection. Datadog generates unique traceIds and propagates the same across all the instrumented downstream microservices automatically. The only thing we need to do is attribute the DD traceId with the logs and we are able to achieve log-trace correlation.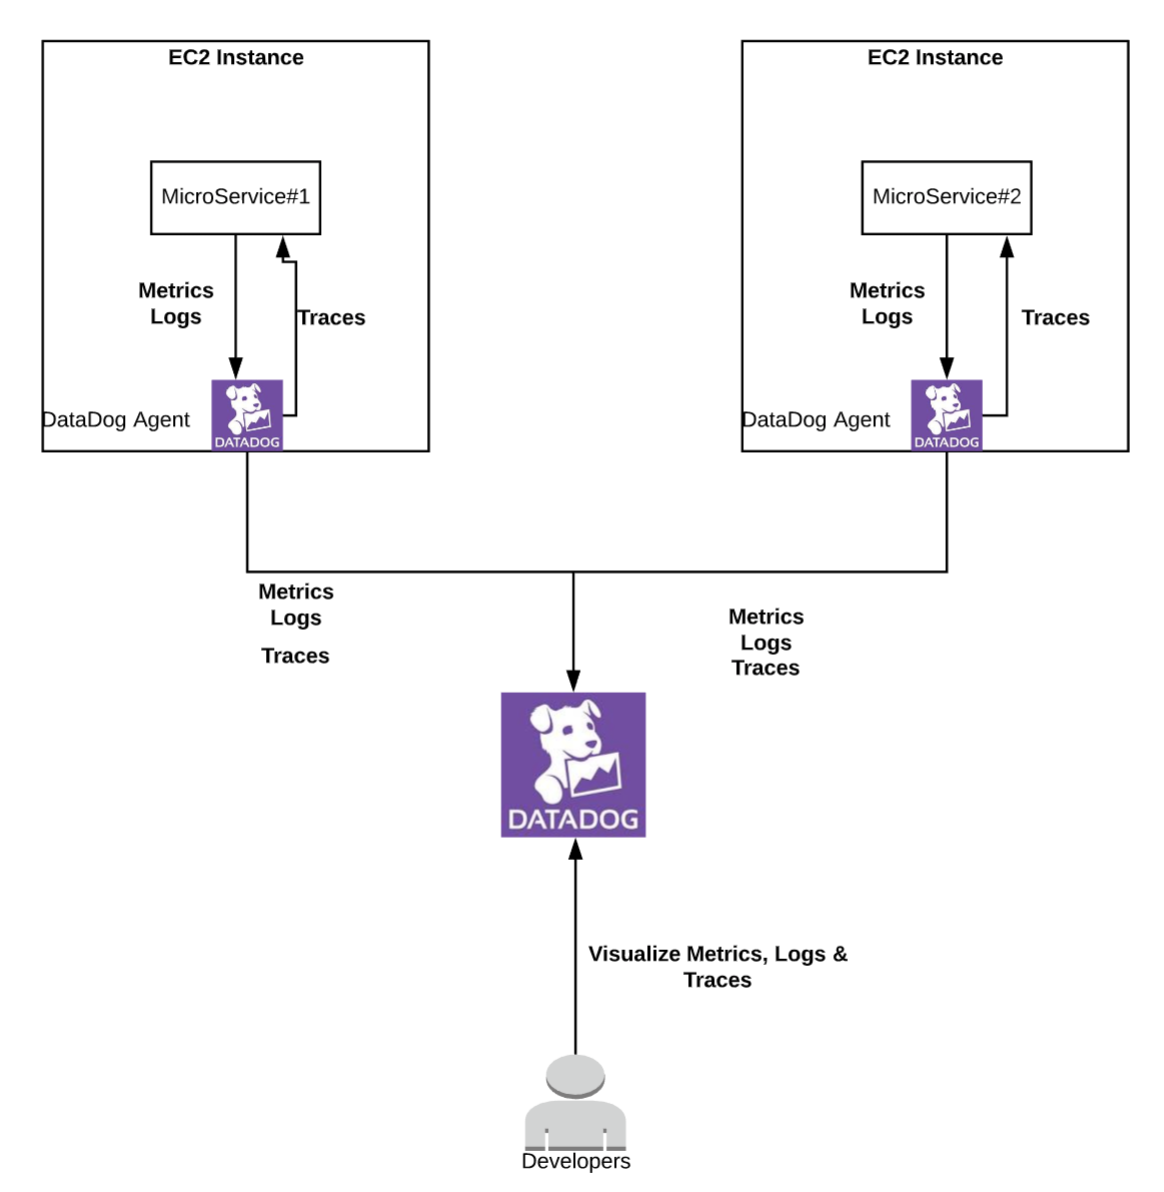
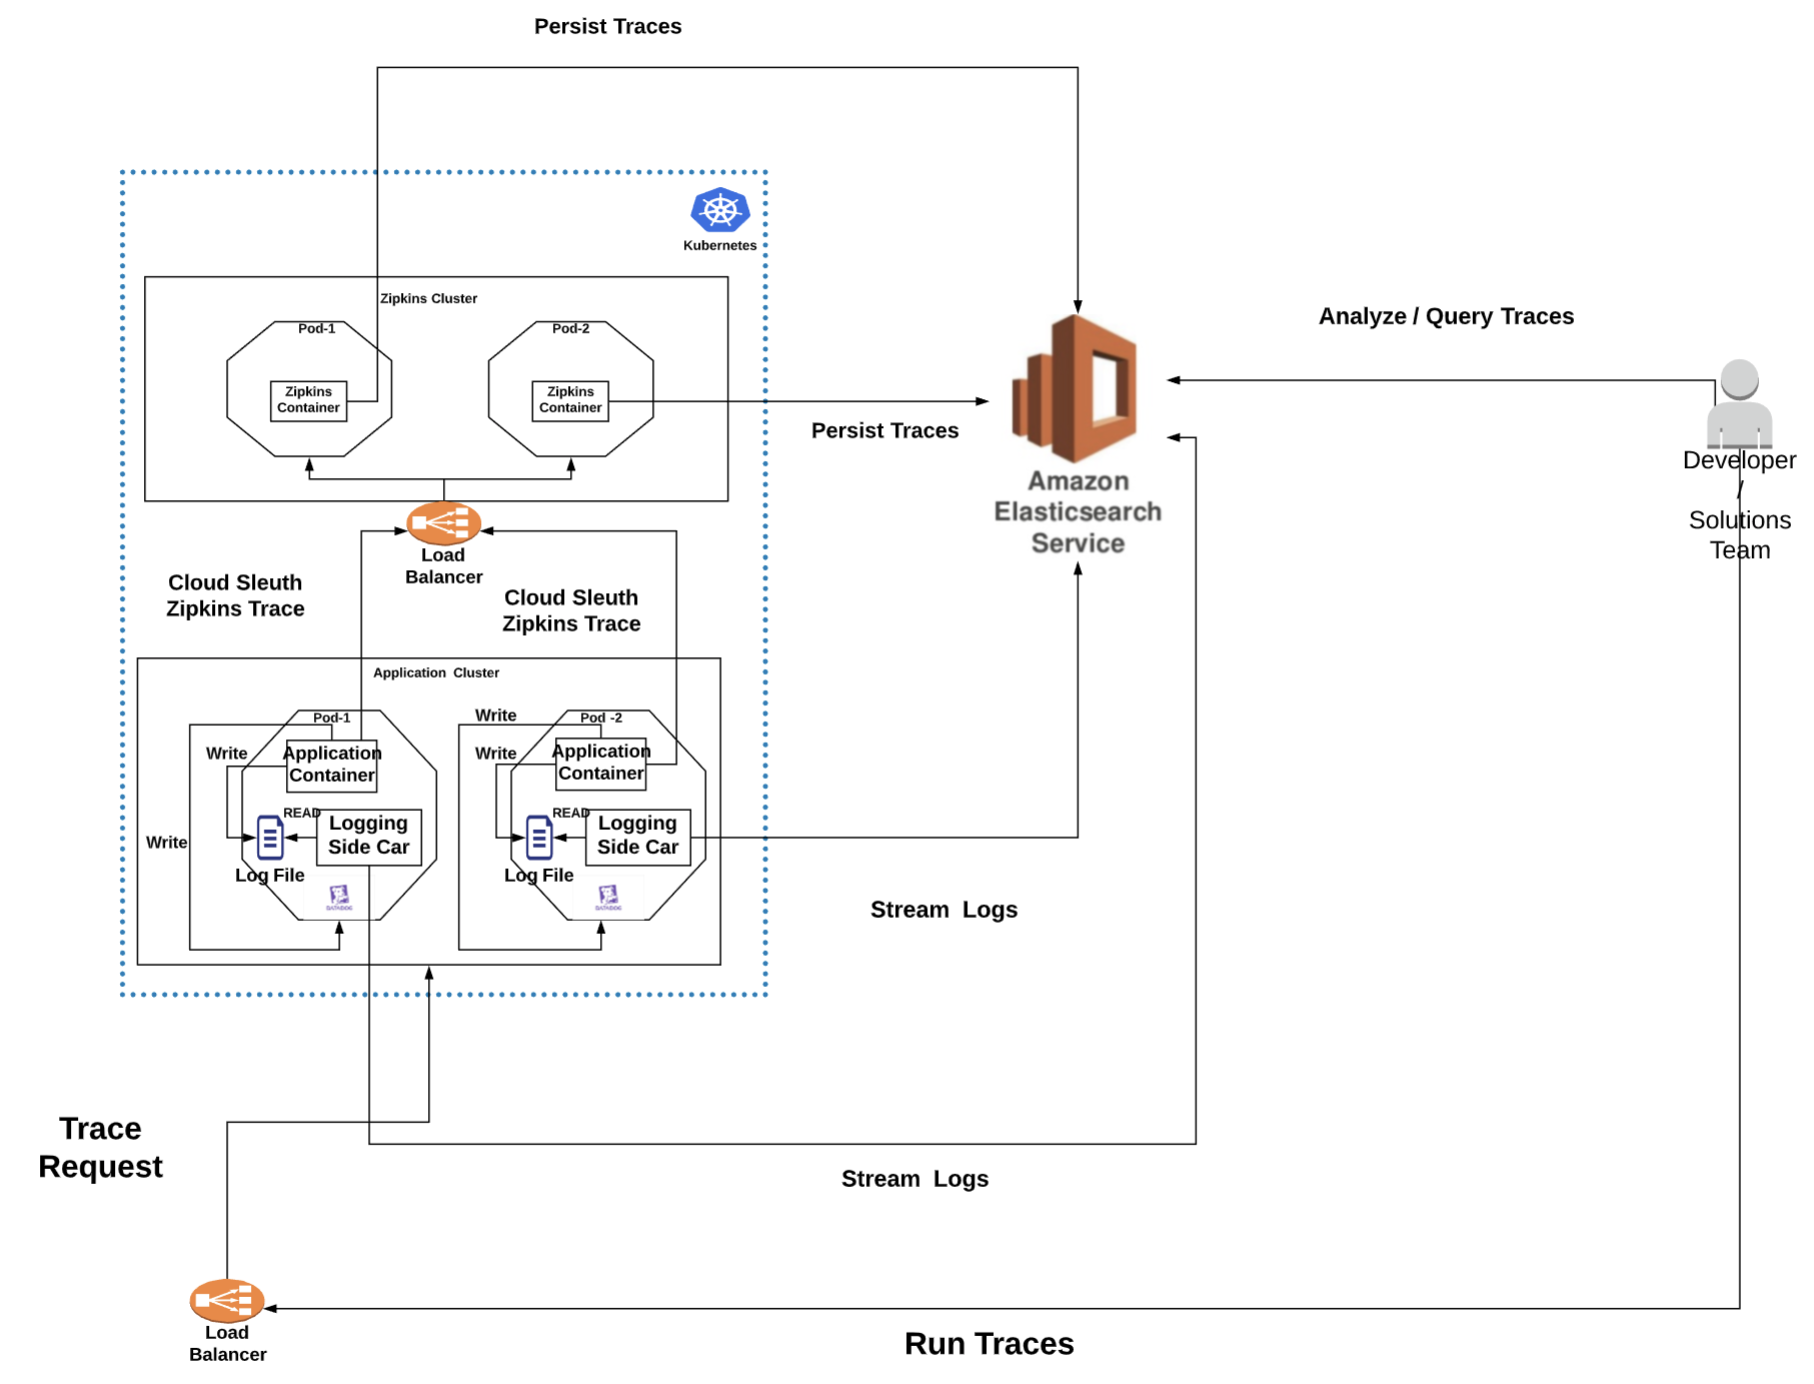
Approach #2: Zipkins, Cloud-Sleuth with Spring Boot Application
Reference: Zipkins Cloud Sleuth Advantages:- Fully integrated into SPRING boot
- Simple and easy to use
- Traces can be visualized using Zipkins UI
- Supports OpenTracing standards via external libraries
- Supports log correlation via Log4j2 MDC contexts
- Does not have a solution to automatically collect LOGs related to trace. We would have to ship logs to ElastiSearch ourself and search using the cloud-sleuth generated trace ids (as header X-B3-TraceId )
Approach #3: Amazon XRAY
Reference: Amazon XRAYAdvantages:
- Supports all AWS resources natively. Good if your distributed services deployed and running in AWS
- AWS Load balancers auto-generate a REQUEST ID per incoming request. Frees up the APPLICATION to generate one. (Reference: https://docs.aws.amazon.com/elasticloadbalancing/latest/application/load-balancer-request-tracing.html)
- Allows tracing all the way from API gateway to load balancer, to service and other dependent AWS resources
- Allows log correlation with help of logs in CLOUDWATCH logs
- Cloudwatch logs can get very expensive with large log volumes
Approach #4: JAGER
Reference: Jager Advantages:- More complicated from infrastructure maintenance perspective and setup