MongoDB-Prod-Cluster-Alerting
Monitoring is a very important aspect of any service. This applies not just to web applications but also to databases and other supporting tools.
On MonogDB Atlas user will have the ability to setup alerts based on various metrics(Host level, DB level and networking level).
In this blog I will try to highlight some of the alerts which will be very useful for monitoring a production MongoDB cluster on Atlas.
Setting Up The Alerts:
-
Log into MongoDB Atlas.
-
Select your cluster.
-
Select the ‘Alerts’ icon on the side bar.
-
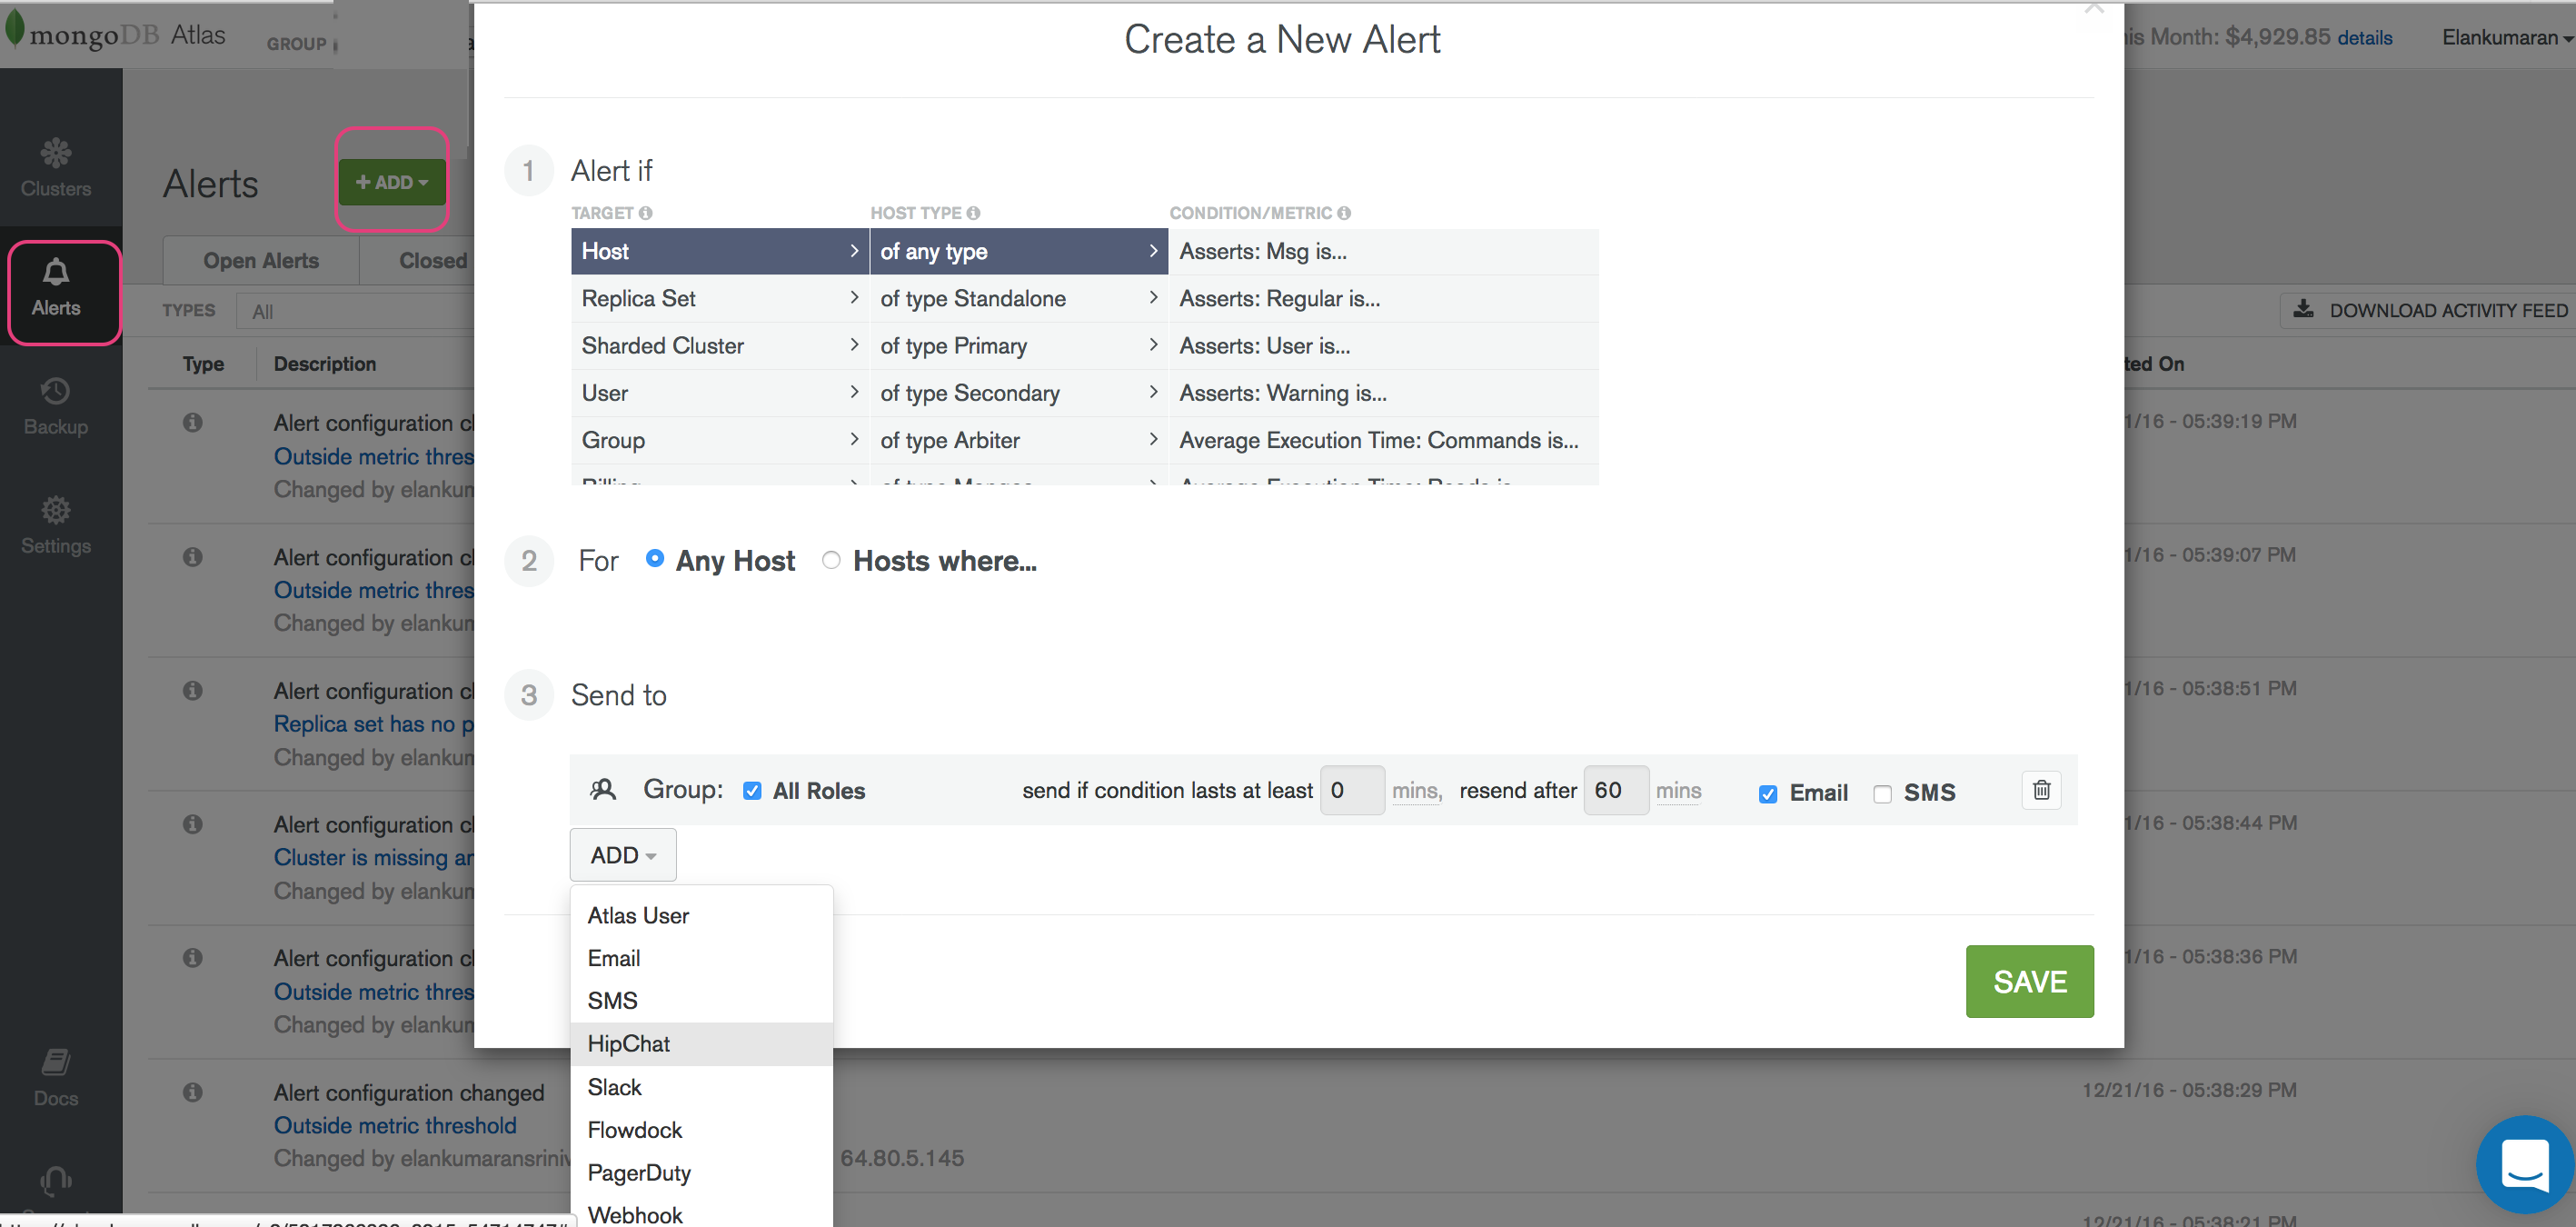
Clicking on ‘Add’ button will bring up a pop-up window which allows you to select various conditions under which to trigger the alerts.
 </img>
Here is a sample of some of the alerts setup on MongoDB Atlas. The alerts are set up to go to
- Group Owner : The set of users who belong to the group associated with the MongoDb cluster.
- Email : Send an email to “mongo.prod.alert@corp.com”
- Slack : Atlas has integration with Slack and can sent the alerts to a slack channel.
There are several other integration that can be setup. The other integrations are shown in the above screenshot.
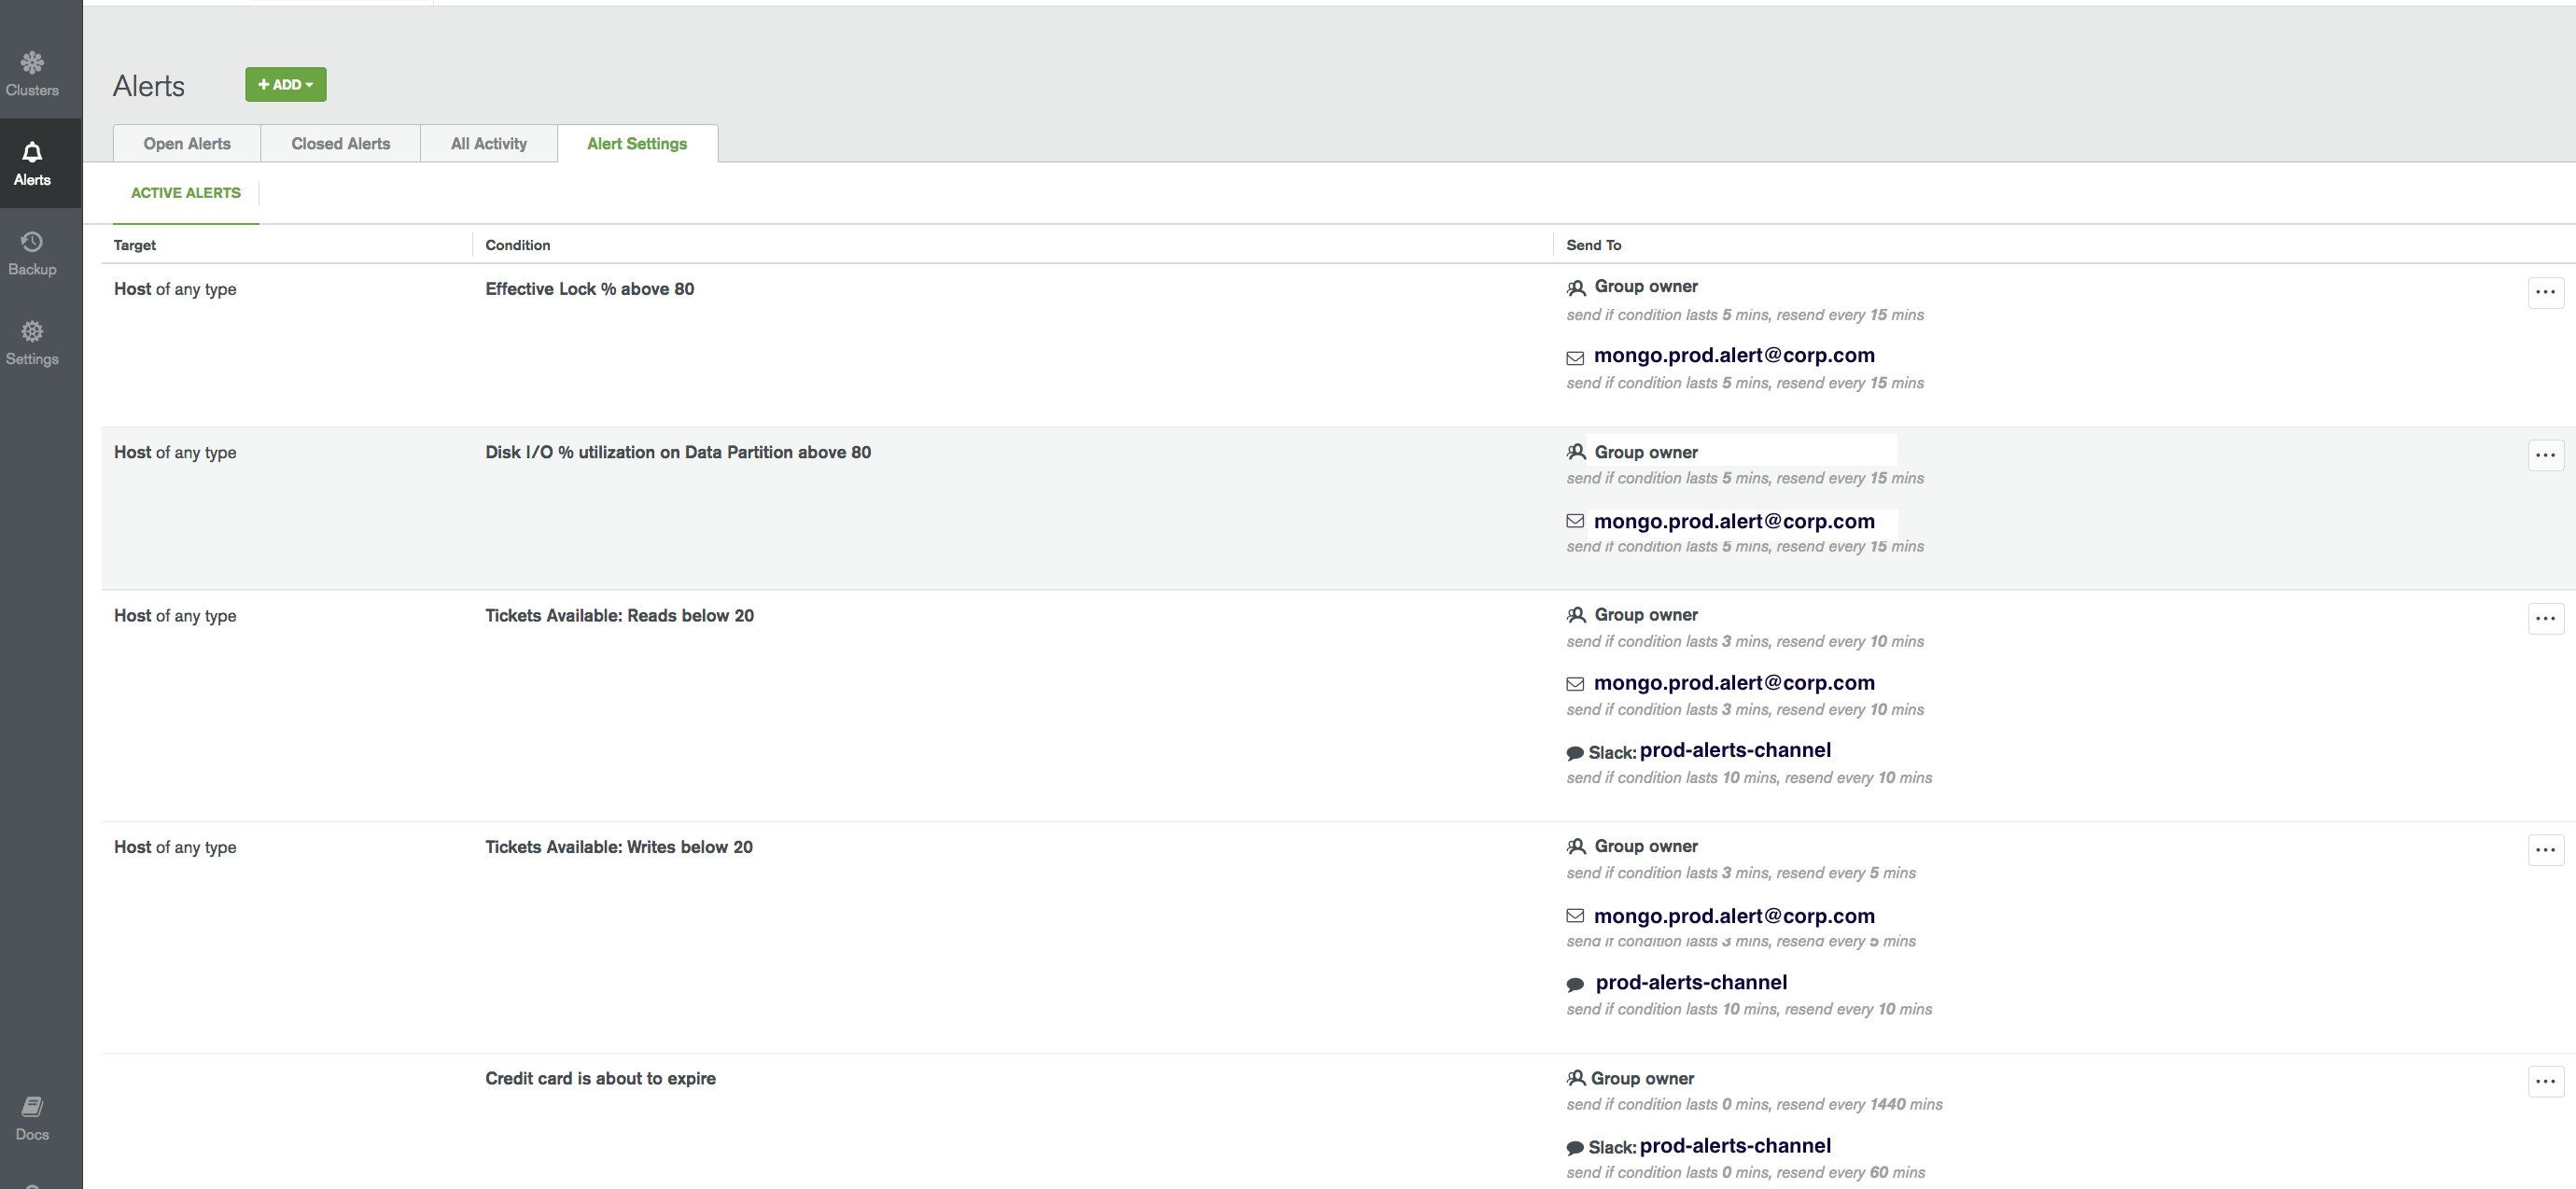
Escalation level can be configured based on how long the error condition or state lasts. The below screenshot has the alert “Tickets Available: Reads below 20” set up as multi level alerting with escalations to the “prod-alerts-channel” (SLACK) if the error condition lasts more than 10 minutes. The first level of alerting always goes to the “Group Owners” and the email group (mongo.prod.alert@corp.com)
 </img>
Alerts (These are setup at host target level)
Condition |
Condition Lasts (Time Period) |
Explanation |
|---|---|---|
Effective lock % above 80 |
5 Minutes |
In WiredTiger the locks are at a document level. Write heavy databases may see lock % upto 60% where as read heavy databases may not see more than 10%.Too much document locking will lead to reduced database query performance for write operations since new writes need to wait till the lock on the document is released by the previous write operation. |
Disk I/O % utilization on Data Partition above 80 |
5 Minutes |
80 % is a good threshold for this. MongoDB caches records in memory for quick retrieval. High I/O utilization may be due to frequent data flush from memory to disk or could be due to large number of cache misses which caused mongo to retrieve the missing documents from the disk. The latter may be due to smaller memory size of the host.Nevertheless, too much disk I/O will induce latency in queries. |
Tickets Available: Read below 20 |
5 Minutes |
MongoDB uses a ticketing system to control the number of concurrent operations that can be performed. Each ticket corresponds to a an operation.This is synonymous with threads in Java programming.By default there are 120 tickets available to the primary host. If the tickets available becomes "0" then all subsequent read operation will queue up until more tickets are available. |
Tickets Available: Writes below 20 |
5 Minutes |
By default there are 120 tickets available to the primary host. If the tickets available becomes "0" then all subsequent write operation will queue up until more tickets are available. |
Queues: Readers above 100 |
5 Minutes |
Reads start queuing up when number of read tickets are zero (0) |
Queues: Writers above 100 |
5 Minutes |
Writes start queuing up when the number of write tickets are zero (0). |
Replication Lag above 1 minute |
5 Minutes |
Mongo commits data to the primary first and the same is replicated asynchronously to the secondaries. If clients are reading data from the secondaries then a large lag time will cause inconsistent/ old data to be returned. |
System:CPU(User)% above 80 |
5 Minutes |
Badly written queries are one of the major reasons for CPU % shooting up. This could be due to a large number of records being scanned to return result or lack of usage of indexes. |
Memory Resident above {} |
5 Minutes |
Resident memory is the total amount of memory being used by MongoDB and its processes.Alert should be triggered when the usage goes above 80% of the total memory available on the host. |
Connections Above {} |
5 Minutes |
https://docs.atlas.mongodb.com/connect-to-cluster/Depending on the type of cluster you setup, that maximum connection should not go above 80% of total connections possible on the instance type.Too many connections could be due to increased traffic or an issue in connection-pooling mechanism of the client code where old connections are not being released or exiting connections are not being reused. |
Average Execution Time: Commands above {} ms |
Immediate |
Trigger alerts if queries take more than "X" miliseconds to execute. This may vary based on the use-cases. |
Disk space % used on Data Partition above 80 |
5 Minutes |
No disk space means, no space for MongoDB to save data. Make sure that there is at-least 20% of free space left on the MongoDB hosts.This will give enough time to scale out of add more disk space. |
Background Flush Average above 1000 ms |
5 Minutes |
MongoDB first makes data changes in memory and then flushes the changed to disk every 60s by default.If journaling is enabled then memory changes are journaled every 100ms and then flushed to disk.The time taken to flush the data to disk is dependent on the DISK i/o available and also on the amount of data being flushed.A large number of write operations will cause large amount of data to be flushed to the disk.Usage of magnetic storage device could be another reason. Solid state storage devices have better I/O capabilities. |
Network Bytes In or Network Bytes Out |
5 Minutes |
Optional.This alert cannot be setup with at the very beginning itself. One needs to observe the Production traffic pattern on the cluster of couple of weeks and use those metrics to come up with a threshold number for the network bytes in / out.This metrics can also be used in conjunction with ops counter.Any aberration in the network pattern could indicate increased traffic or possible attack on the system. |