In this blog I will focus on explain how to perform common operations on a given collection in MongoDB.
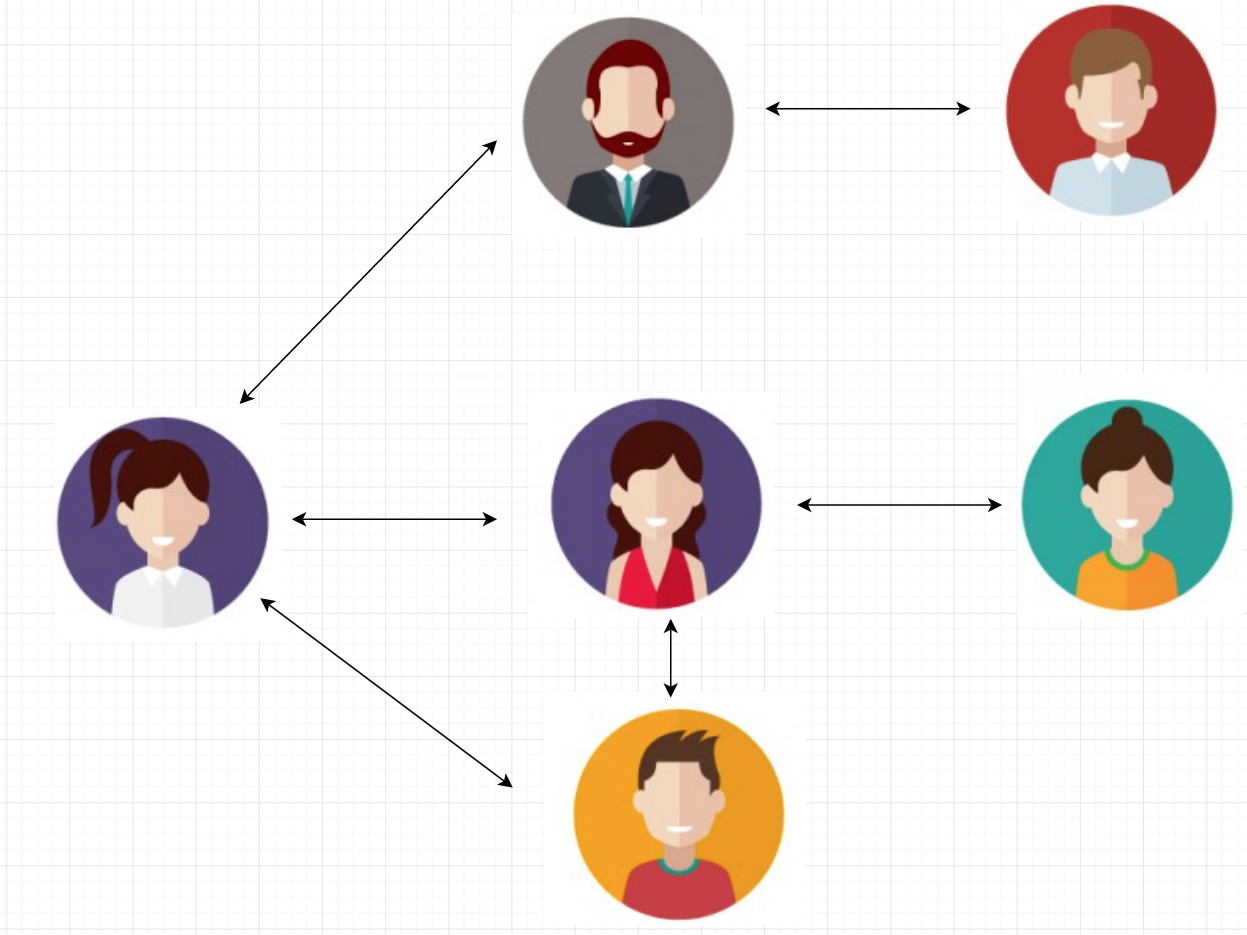
Let consider a scenario where we have a messaging APP. An user can communicate with one or more users through the application and the system will track all the communication in MongoDB.
 </img>
Let consider a scenario where we have a messaging APP. An user can communicate with one or more users through the application and the system will track all the communication in MongoDB.
 </img>
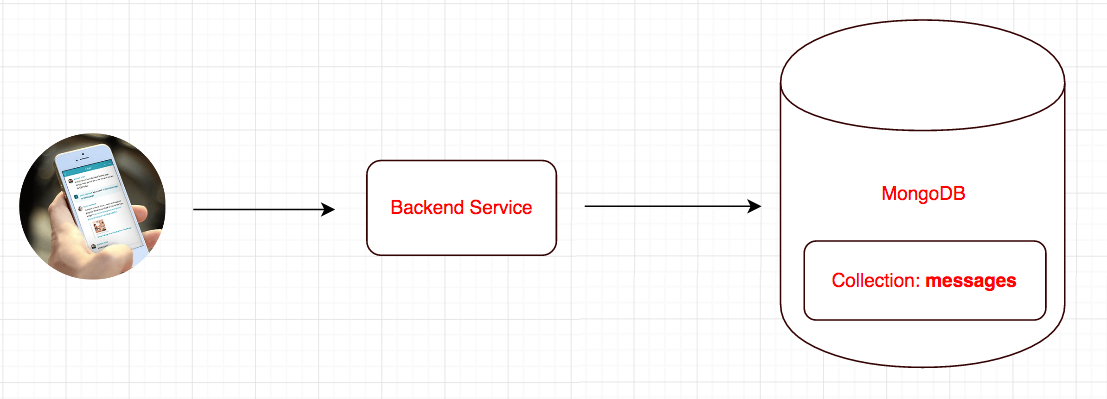
We have a collection named “messages” in MongoDB.
Below is a sample documents that are stored in the collection:
{
	"_id": "582a15149bbc2d2f8898628b",
	"senderUserId": 1234,
	"receiverUserId": 7890,
	"message": Hi, How are you?,
	"sentDate": ISODate("2016-11-14T19:48:36.379Z"),
	"read": false
},
{
	"_id": "722a15149bbc4d2f8898628b",
	"senderUserId": 7890,
	"receiverUserId": 1234,
	"message": "I am doing well. How about you?",
	"sentDate": ISODate("2016-11-15T2:10:11.123Z")
	"read": true
}, {
	"_id": "150000149bb42d2f8898628b",
	"senderUserId": 5678,
	"receiverUserId": 2222,
	"message": "Hola !!!",
	"sentDate": ISODate("2016-11-17T01:04:6.079Z"),
	"read" : false

}
Query #1 - Create document (User sends a message to another)
db.getCollection('messages').insertOne({
	"_id": "582a15149bbc2d2f8898628b",
	"senderUserId": "1234",
	"receiverUserId": "7890",
	"message": "Hi, How are you?",
	"sentDate": ISODate("2016-11-14T19:48:36.379Z"),
	"read": false
})
Query #2 - Message history between two users with the most recent message at the bottom
db.getCollection('messages').find({
	$or: [{
		senderUserId: 1234,
		receiverUserId: 7890
	}, {
		senderUserId: 7890,
		receiverUserId: 1234
	}]
}).sort({
	sentDate: 1
})
Query #3 - Retrieve all messages received by an user from other users and which are still unread by the receiving user
db.getCollection('messages').find({
	receiverUserId: 1234,
	read: false
}).sort({
	sentDate: 1
})
Query #4 - Retrieve all messages sent by an user to other users
db.getCollection('messages').find({
	senderUserId: 1234,
}).sort({
	sentDate: 1
})
Query #5 - Retrieve count of all messages sent by the user till date
db.getCollection('messages').find({
senderUserId: 1234,
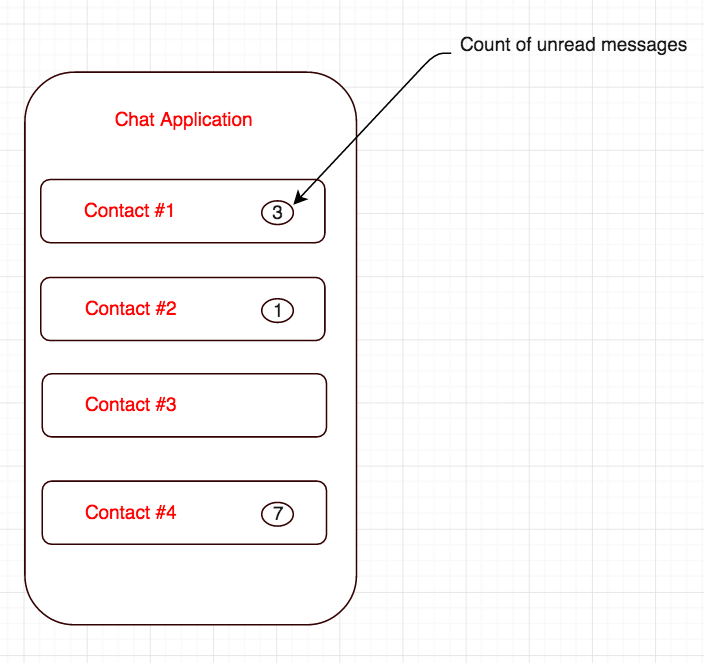
}).count()Query #6 - Retrieve grouped count of unread messages per contact
 </img>
db.getCollection('messages').aggregate([{
		$match: {
			receiverUserId: 1234
		}
	},
	{
		$group: {
			_id: "$senderUserId",
			count: {
				$sum: 1
			}
		}
	}

])
The only problem with the above query is that the order of the result is not guaranteed. We want the results to contain the results where the contact with the most recent communication comes at the top. In order to achieve this order, we need to sort the result in descending order of ‘sendDate’ field. The contact is nothing but the sender.
The above query can be rewritten as following :
db.getCollection('messages').aggregate([{
		$match: {
			receiverUserId: 1234
		}
	},
	{
		$sort: {
			sentDate: -1
		}
	}, {
		$group: {
			_id: "$senderUserId",
			count: {
				$sum: 1
			},
			sentDate: {
				$first: "$sentDate"
			}
		}
	}
	,
	{
		$sort: {
			sentDate: -1
		}
	}, {
		$project: {
			_id: 1,
			count: 1
		}
	}
])
Query #7: Get a unique list of Ids of all people that the user sent messages to
db.getCollection('messages').aggregate([{
		$match: {
			senderUserId: 1234
		}
	}, {
		$group: {
			"_id": "$receiverUserId"
		}
	}, {
		$project: {
			"receiverUserId": "$_id",
			"_id": 0
		}
	}

]);
Query #7: Count of messages sent by the user to each of the contacts
db.getCollection('messages').aggregate([{
		$match: {
			senderUserId: 1234
		}
	}, {
		$group: {
			"_id": "$receiverUserId",
			count: {
				$sum: 1
			}
		}
	},
	{
		$project: {
			"receiverUserId": "$_id",
			"_id": 0,
			count: 1
		}
	}
]);
Query #8: Get paginated list of messages sent between an user and another user [ Pagination Approach #1 : Using pageSize and pageNum ]
db.getCollection('messages').find({
	senderUserId: 1234,
	receiverUserId: 7890
}).sort({sentDate:-1}).skip(0).limit(10)       // Fetch the first page of the paginated messages. Each page will have 10 messages


db.getCollection('messages').find({
	senderUserId: 1234,
	receiverUserId: 7890
}).sort({sentDate:-1}).skip(10).limit(10)       // Fetch the second page of the paginated messages.


General format :

db.getCollection('messages').find({
	senderUserId: 1234,
	receiverUserId: 7890
}).sort({sentDate:-1}).skip(pageNum-1 * pageSize ).limit(pageSize)       // General format for fetching messages
Query #9: Get list of messages sent between an user and another match [Pagination Approach #2 : Range based pagination]
// Fetch 10 messages that were exchanged between the users before the provided time frame.

db.getCollection('messages').find({
	senderUserId: 1234,
	receiverUserId: 7890,
	sentDate: {
		$lt: ISODate("2016-11-14T19:48:36.379Z")
	}
}).sort({
	sentDate: -1
}).limit(10)


// Fetch 10 messages that were exchanged between the users after the provided time frame.

db.getCollection('messages').find({
	senderUserId: 1234,
	receiverUserId: 7890,
	sentDate: {
		$gt: ISODate("2016-11-14T19:48:36.379Z")
	}
}).sort({
	sentDate: 1
}).limit(10)
Query #10: Update messages received by an an user from another user as read.
db.getCollection('messages').update({
	receiverUserId: 1234,
	senderUserId: 7890,
	read: false
}, {
	$set: {
		read: true
	}
}, {
	multi: true
}) </img>
 </img>
 </img>
 </img>
 </img>
 </img>